. 2010 Jan 20;30(3):820-31.
doi: 10.1523/JNEUROSCI.3400-09.2010.

Hermansky-Pudlak protein complexes, AP-3 and BLOC-1, differentially regulate presynaptic composition in the striatum and hippocampus

Affiliations

Hermansky-Pudlak protein complexes, AP-3 and BLOC-1, differentially regulate presynaptic composition in the striatum and hippocampus

Karen Newell-Litwa et al. J Neurosci. .

Abstract

Endosomal sorting mechanisms mediated by AP-3 and BLOC-1 are perturbed in Hermansky-Pudlak Syndrome, a human genetic condition characterized by albinism and prolonged bleeding (OMIM #203300). Additionally, mouse models defective in either one of these complexes possess defective synaptic vesicle biogenesis (Newell-Litwa et al., 2009). These synaptic vesicle phenotypes were presumed uniform throughout the brain. However, here we report that AP-3 and BLOC-1 differentially regulate the composition of presynaptic terminals in the striatum and dentate gyrus of the hippocampus. Quantitative immunoelectron microscopy demonstrated that the majority of AP-3 immunoreactivity in both wild-type striatum and hippocampus localizes to presynaptic axonal compartments, where it regulates synaptic vesicle size. In the striatum, loss of AP-3 (Ap3d(mh/mh)) resulted in decreased synaptic vesicle size. In contrast, loss of AP-3 in the dentate gyrus increased synaptic vesicle size, thus suggesting anatomically specific AP-3-regulatory mechanisms. Loss-of-function alleles of BLOC-1, Pldn(pa/pa), and Muted(mu/mu) revealed that this complex acts as a brain-region-specific regulator of AP-3. In fact, BLOC-1 deficiencies selectively reduced AP-3 and AP-3 cargo immunoreactivity in presynaptic compartments within the dentate gyrus both at the light and/or electron microscopy level. However, the striatum did not exhibit these BLOC-1-null phenotypes. Our results demonstrate that distinct brain regions differentially regulate AP-3-dependent synaptic vesicle biogenesis. We propose that anatomically restricted mechanisms within the brain diversify the biogenesis and composition of synaptic vesicles.


Figures

Figure 1.
Figure 1.
AP-3 is found throughout the brain with prominent expression in the hippocampus and striatum. A, Immunoperoxidase labeling of control (+/+; A, A2, A4) and AP-3-deficient mocha (mh/mh; A1, A3, A5) striatum in the presence or absence of the monoclonal primary antibody against the δ subunit of AP-3 (Anti AP-3 δ). Binding of the anti-AP-3 δ antibody to the endogenous antigen is outcompeted by incubation with the antigenic δ peptide corresponding to the amino acids 680–710 of human δ adaptin (AAD03777; GI:1923266); see A4. B–C1, Immunoperoxidase labeling of AP-3 in the hippocampus (B), the CA3 region of the hippocampus (B1), the dentate gyrus of the hippocampus (DG; B2), and the striatum (Str; C, C1) of control mouse brain. Scale bars, 1 mm.
Figure 2.
Figure 2.
AP-3 localizes to synaptic terminals of the dentate gyrus. A, Fixed E18.5 wild-type C57 mouse primary neuron (DIV 14) immunostained for AP-3, the AP-3 cargo VAMP7-TI, and the synaptic vesicle protein VAMP2/synaptobrevin. Arrows indicate discrete punctae within the neuronal process where all three proteins colocalize. B, Confocal images of control grizzled dentate gyrus immunostained for AP-3 cargo VAMP7-TI and the synaptic vesicle protein, synaptophysin. C, Confocal images of control grizzled dentate gyrus immunostained for AP-3 and the AP-3 cargo VAMP7-TI. Note that AP-3 immunoreactivity is coexpressed with VAMP7-TI in synaptic terminals, but is also found in neuronal cell bodies (bottom rows). The bottom panels in B and C are higher magnifications of the dentate gyrus images shown in the top rows. Scale bar, 25 μm.
Figure 3.
Figure 3.
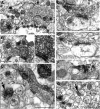
Ultrastructural localization of AP-3 by immunoelectron microscopy. AP-3 was detected with the monoclonal antibody against the AP-3 δ subunit and revealed by biotinylated anti-mouse antibodies and the avidin-biotin peroxidase complex. A–F, AP-3 partially labels axon terminals of the striatum (C, E, and F), the CA3 region of the hippocampus (A), and the dentate gyrus (B, D). AP-3 partially labels a preterminal axon in the striatum (C). C, G, AP-3 either partially (white arrows) or wholly (black arrows) labels unmyelinated axons of the striatum (C) and the dentate gyrus (G). AP-3 also labels a dendritic spine in the striatum (F). The frequency of labeling in specific elements is quantified in Figure 4. Scale bar, 0.5 μm. Te, Terminals; Ua, unmyelinated axons; Sp, spines.
Figure 4.
Figure 4.
The majority of AP-3 partially labels axons in the striatum and hippocampus. Quantification of the number and type of elements immunoreactive for AP-3 per field in electron micrographs of control mouse brain (control grizzled and heterozygous Muted +/mu). We classified the labeled neural structures into the following categories according to ultrastructural criteria defined in Peters et al. (1991): spines, dendrites, axons [axon terminals (AT), myelinated axons (MA), unmyelinated axons (UA), and “other” (glia and unidentifiable structures)]. A, In both the striatum and hippocampus (CA3 and dentate gyrus), AP-3 labels axons (∼5–6 AP-3-positive axons/field), dendrites (∼0.5–1 AP-3-positive dendrite/field), and other elements (∼0.1–0.15 AP-3-positive other/field). B, AP-3 localizes to both unmyelinated axons (∼1.3–2.4 small UA/field; ∼2–3 UA/field; negligible AP-3 immunoreactivity in MA) and axon terminals (∼1 AT/field). C, The majority of AP-3-positive axons exhibit partial labeling (∼3–5 partially labeled axons/field) rather than immunoperoxidase labeling throughout the terminal (all) (∼1.4–1.9 all/field; *p < 0.0001). (n = 4; 147 for striatum; n = 4; 76 for CA3; n = 4; 102 for dentate gyrus; n = number of animals; number of analyzed fields). A field is defined as the area covered by an electron micrograph that corresponds to 11.14 μm2. Fifty percent of the population is contained in the rectangle, which is bisected by the median of the population. One hundred percent of the population is contained in between the brackets.
Figure 5.
Figure 5.
AP-3 differentially regulates synaptic vesicle size in asymmetric excitatory synapses of the striatum and dentate gyrus. A–D, Representative electron micrographs of asymmetric excitatory synapses from (A, B) control (Ap3d +/+) and (C, D) AP-deficient (Ap3dmh/mh) striatum. Sp denotes spines apposed to presynaptic terminals. E–G, Synaptic vesicles in terminals forming asymmetric synapses in the striatum of Ap3dmh/mh mice (F–G) are smaller than those in Ap3d +/+ animals (E). H, I, Representative electron micrographs of asymmetric excitatory synapses from (H) control (Ap3d +/+) and (I) AP-deficient (Ap3dmh/mh) dentate gyrus. J, K, Synaptic vesicles from terminals forming asymmetric synapses of the dentate gyrus in Ap3dmh/mh (K) exhibit a larger size than those in Ap3d +/+ mice (J). Statistical analyses of synaptic vesicle sizes in the striatum and the dentate gyrus between mutant and wild-type mice are shown in Figure 6. Scale bars: A–D and H, I, 0.2 μm; G (valid for EG) 0.066 μm; K (valid for K, J) 0.066 μm.
Figure 6.
Figure 6.
Quantification of synaptic vesicle size in terminals forming asymmetric axo-spinous synapses in the striatum and dentate gyrus of Ap3d +/+ and Ap3dmh/mh mouse brain. The distribution in the area of individual synaptic vesicles is represented as both a frequency histogram (top panel) and probability plot (bottom panel). A, Synaptic vesicles from terminal boutons forming asymmetric synapses in wild-type dentate gyrus are statistically smaller than those in wild-type striatum (p < 0.0001 Kolmogorov–Smirnoff test). B, Loss of AP-3 (Ap3dmh/mh) significantly reduces synaptic vesicle size in terminals forming asymmetric synapses in the striatum (p < 0.0001 Kolmogorov–Smirnoff test). C, Loss of AP-3 (Ap3dmh/mh) significantly increases synaptic vesicle size in terminals forming axo-spinous asymmetric synapses of the dentate gyrus (p < 0.0001 Kolmogorov–Smirnoff test). n = 3; 75; 9456 for Ap3d +/+ striatum; n = 3; 32; 5472 for Ap3dmh/mh striatum; n = 3; 19; 3402 for Ap3d +/+ dentate gyrus; n = 3; 18; 3376 for Ap3dmh/mh dentate gyrus; n = number of animals; number of analyzed synaptic terminals; total number of analyzed synaptic vesicles. Graphs represent the pooled data from 3 control or 3 mocha mice.
Figure 7.
Figure 7.
AP-3 and BLOC-1 form a complex in PC12 cells and synaptosome-enriched rat brain fractions. A, Immunoprecipitation of AP-3 complexes from synaptosome-enriched rat brain fractions. Immunoprecipitation with the monoclonal antibody against AP-3 δ (lanes 5 and 6) isolates AP-3 and the following interacting proteins: VGlut1 and the BLOC-1 subunits, dysbindin and pallidin in the presence of DSP selective crosslinking (lane 6). AP-3 does not interact with TrfR (lanes 3 and 4). Immunoprecipitation with antibodies against TrfR, while capable of isolating TrfR, do not bring down AP-3, VGlut1, or BLOC-1 subunits, dysbindin, and pallidin (lanes 3 and 4). None of these proteins were precipitated with beads alone (lanes 1–2). Lanes 7–8 = 5% input. B, Immunoprecipitation of AP-3 complexes from PC12 cells. Immunoprecipitation with the monoclonal antibody against AP-3 δ (lanes 3 and 4) isolates AP-3 and the following interacting proteins: VGlut1, phosphatidylinositol-4-kinase type II α (PI4KIIα), the BLOC-1 subunits, dysbindin, muted, and pallidin in the presence of DSP (lane 4). AP-3 does not interact with either TrfR or Sphysin (lane 5). Immunoprecipitation with antibodies against TrfR, while capable of isolating TrfR, do not bring down AP-3, VGlut1, PI4KIIα, or BLOC-1 subunits, dysbindin, muted, and pallidin (lanes 1 and 2). Lane 5 = 5% input.
Figure 8.
Figure 8.
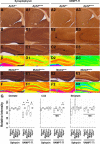
Deficiencies of AP-3 and BLOC-1 selectively reduce VAMP7-TI, but not synaptophysin, expression in the dentate gyrus. A–F1, Immunoperoxidase labeling with a monoclonal antibody against synaptophysin in (A–F) control (Ap3d +/+ and Muted+/mu) and (A1–F1) AP-3- and BLOC-1-deficient mouse brain (Ap3dmh/mh and Mutedmu/mu) in the striatum (A, A1), CA3 region of the hippocampus (B, B1), and the dentate gyrus of the hippocampus (C–F1). Heat maps of the dentate gyrus are represented in D and D1 and F and F1. A2–F3, Immunoperoxidase labeling with a monoclonal antibody against VAMP7-TI in control (Ap3d +/+ and Muted+/mu) (A2–F2) and AP-3- and BLOC-1-deficient mouse brain (Ap3dmh/mh and Mutedmu/mu) (A3–F3) in the striatum (A2, A3), CA3 region of the hippocampus (B2, B3), and the dentate gyrus of the hippocampus (C2–F3). Heat maps of the dentate gyrus are represented in D2–D3 and F2–F3. G, Quantification of Sphysin and VAMP7-TI expression in the dentate gyrus, CA3 pyramidal cell layer of the hippocampus, and the striatum in control (Pldn +/+, Muted +/mu, and Ap3d +/+). Quantification of Sphysin and VAMP7-TI expression in the dentate gyrus, CA3 pyramidal cell layer of the hippocampus, and the striatum in control (Pldn +/+, Muted +/mu, and Ap3d +/+) Synaptophysin is unaffected by either AP-3 or BLOC-1 deficiencies in all brain regions. VAMP7-TI is preferentially reduced in the dentate gyrus of the hippocampus in all AP-3 and BLOC-1 deficiencies (*p = 0.05, Mutedmu/mu; *p < 0.03, Pldnpa/pa; *p < 0.0007, Ap3dmh/mh). For Sphysin in the dentate gyrus and CA3 region of the hippocampus, n = (2,4); (2,4); (2,4); (2,4); (3,6); (3,8). For VAMP7-TI in the dentate gyrus and CA3 region of the hippocampus, n = (2,4); (2,4); (2,4); (2,5); (3,6); (3,8). For Sphysin and VAMP7-TI in the striatum, n = (2,4); (2,8); (2,4); (1,2); (3,6); (3,8). All intensity readings were normalized to background intensity of AP-3 immunoreactivity in AP-deficient (Ap3dmh/mh) or unstained mouse brain sections. Asterisks mark anatomical location used for quantifications. NS, Nonsignificant.
Figure 9.
Figure 9.
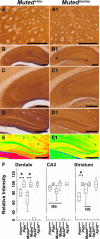
BLOC-1 deficiencies reduce AP-3 expression in the dentate gyrus. A–E1, Immunoperoxidase labeling of control (Muted +/mu) and BLOC-1-deficient (Mutedmu/mu) mouse brain with the monoclonal antibody against the δ subunit of AP-3 in striatum (A, A1), hippocampus (B, B1), CA3 region of the hippocampus (C, C1), and the dentate gyrus (D, D1) of the hippocampus. Heat maps of the dentate gyrus are represented in E and E1. F, Quantification of AP-3 expression in the dentate gyrus, CA3 pyramidal cell layer of the hippocampus, and the striatum in control (Pldn +/+, Muted +/mu, and Ap3d +/+) and BLOC-1-deficient (Pldnpa/pa, Mutedmu/mu) and AP-3-deficient (Ap3dmh/mh) mouse brain. The relative intensity of AP-3 is significantly decreased in the dentate gyrus (*p < 0.004 for Mutedmu/mu and p < 0.0002 for Pldnpa/pa) as well as in the striatum of Pldnpa/pa mice (*p < 0.004). n = (number of animals, number of Vibratome brain sections), listed in the following order Pldnpa/pa; Pldn +/+; Mutedmu/mu; Muted +/mu; Ap3dmh/mh; Ap3d +/+. For AP-3 in the dentate gyrus, n = (2,4); (2,8); (4,8); (2,8); (1,2); (1,3). For AP-3 in the CA3 region of the hippocampus, n = (2,4); (2,8); (4,8); (2,8); (1,2); (1,2). For AP-3 in the striatum, n = (2,4); (2,8); (4,8); (2,6); (1,4); (1,4). All intensity readings were normalized to background intensity of AP-3 immunoreactivity in AP-deficient (Ap3dmh/mh) or unstained mouse brain sections. Asterisks mark anatomical location used for quantifications. NS, Nonsignificant.
Figure 10.
Figure 10.
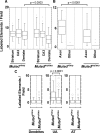
BLOC-1 deficiency reduces axonal AP-3 in the dentate gyrus. Quantification of the number and type of elements immunoreactive for AP-3 per field in electron micrographs of control (Muted +/mu) and BLOC-1-deficient (Mutedmu/mu) mouse brain. A, Total number of AP-3-labeled elements in the striatum, CA3 region of the hippocampus, and the dentate gyrus in Muted +/mu and Mutedmu/mu electron micrographs. AP-3 labeling is significantly reduced in the dentate gyrus of Mutedmu/mu mice compared with Muted +/mu animals (p < 0.0003). B, Comparison of axonal AP-3 labeling with labeling in ‘other’ (glia and unidentifiable) elements in the dentate gyrus of Muted +/mu and Mutedmu/mu. BLOC-1 deficiency significantly reduces AP-3 labeling in axons (p < 0.0001). C, AP-3 labeling of dendrites, unmyelinated axons (UA), and axon terminals (AT) in the dentate gyrus of Muted +/mu and Mutedmu/mu. BLOC-1 deficiency significantly reduces the number of AP-3-labeled UAs (p < 0.0001). (n = 2; 52 for Muted +/mu striatum; n = 3; 82 for Muted mu/mu striatum; n = 2; 37 for Muted +/mu CA3; n = 3; 80 for Mutedmu/mu CA3; n = 2; 47 for Muted +/mu dentate gyrus; n = 3, 97 for Mutedmu/mu dentate gyrus; n = number of animals; number of analyzed fields). A field is defined as the area covered by an electron micrograph which correspond to 11.14 μm2. Graphs represent the pooled data from either all control (Muted +/mu) or all BLOC-1 deficient (Muted mu/mu) mice. Fifty percent of the population is contained in the rectangle, which is bisected by the median of the population. One-hundred percent of the population is contained in between the brackets.

Similar articles

Cited by

References

    1. Advani RJ, Yang B, Prekeris R, Lee KC, Klumperman J, Scheller RH. VAMP-7 mediates vesicular transport from endosomes to lysosomes. J Cell Biol. 1999;146:765–776. - PMC - PubMed
    1. Akbergenova Y, Bykhovskaia M. Enhancement of the endosomal endocytic pathway increases quantal size. Mol Cell Neurosci. 2009;40:199–206. - PMC - PubMed
    1. Baude A, Nusser Z, Molnár E, McIlhinney RA, Somogyi P. High-resolution immunogold localization of AMPA type glutamate receptor subunits at synaptic and non-synaptic sites in rat hippocampus. Neuroscience. 1995;69:1031–1055. - PubMed
    1. Blumstein J, Faundez V, Nakatsu F, Saito T, Ohno H, Kelly RB. The neuronal form of adaptor protein-3 is required for synaptic vesicle formation from endosomes. J Neurosci. 2001;21:8034–8042. - PMC - PubMed
    1. Chen XW, Feng YQ, Hao CJ, Guo XL, He X, Zhou ZY, Guo N, Huang HP, Xiong W, Zheng H, Zuo PL, Zhang CX, Li W, Zhou Z. DTNBP1, a schizophrenia susceptibility gene, affects kinetics of transmitter release. J Cell Biol. 2008;181:791–801. - PMC - PubMed

Publication types

MeSH terms