. 2010 Mar 15;588(Pt 6):907-22.
doi: 10.1113/jphysiol.2009.182196. Epub 2010 Jan 18.

Reduced expression of the Ca(2+) transporter protein PMCA2 slows Ca(2+) dynamics in mouse cerebellar Purkinje neurones and alters the precision of motor coordination

Affiliations

Reduced expression of the Ca(2+) transporter protein PMCA2 slows Ca(2+) dynamics in mouse cerebellar Purkinje neurones and alters the precision of motor coordination

Ruth M Empson et al. J Physiol. .

Abstract

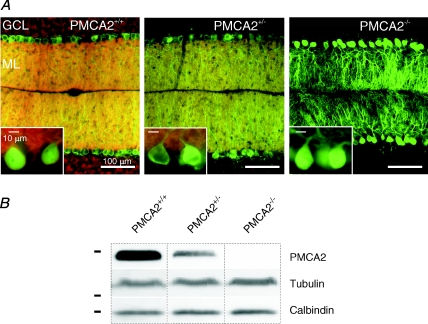
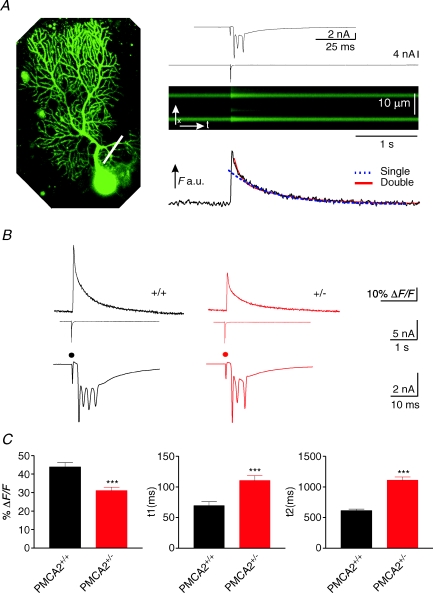
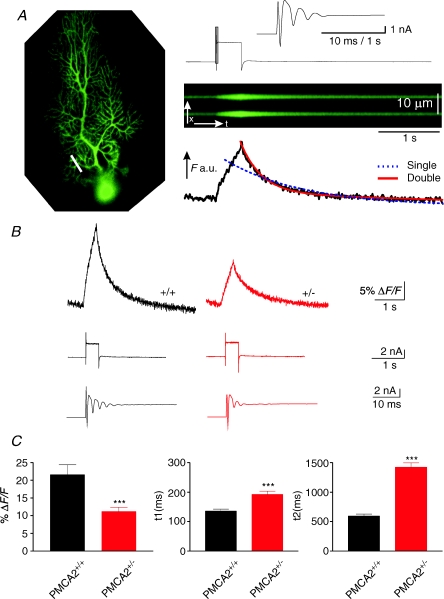
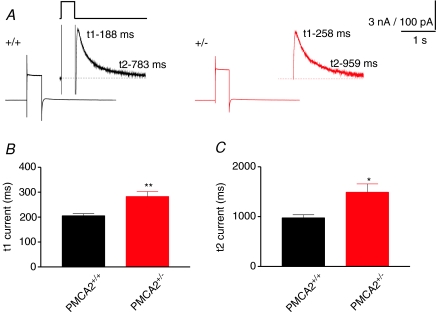
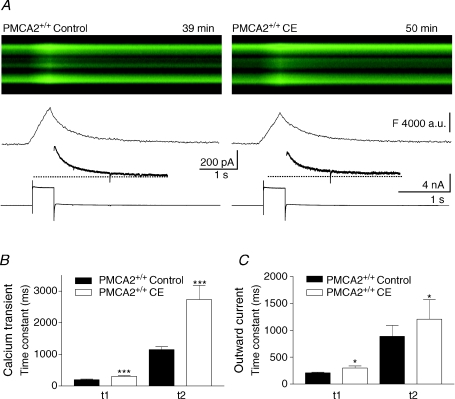
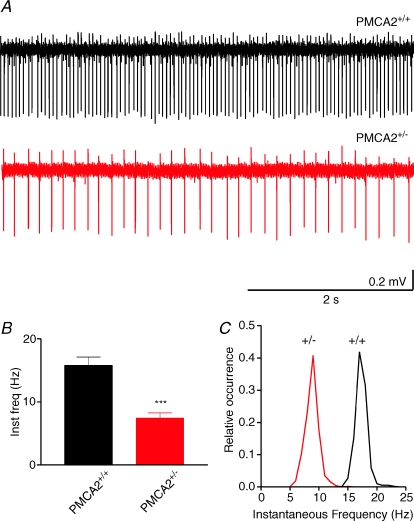
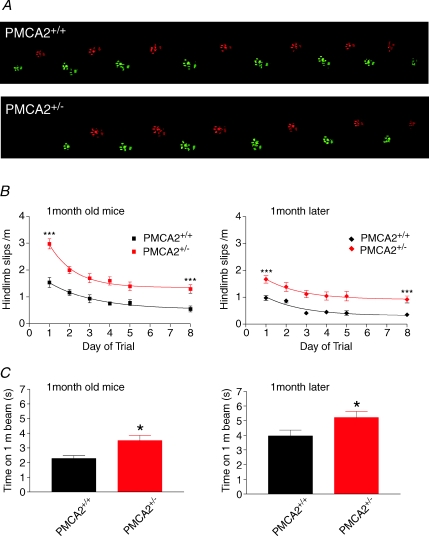
Cerebellar Purkinje neurones (PNs) express high levels of the plasma membrane calcium ATPase, PMCA2, a transporter protein critical for the clearance of calcium from excitable cells. Genetic deletion of one PMCA2 encoding gene in heterozygous PMCA2 knock-out (PMCA2(+/-) mice enabled us to determine how PMCA2 influences PN calcium regulation without the complication of the severe morphological changes associated with complete PMCA2 knock-out (PMCA2(-/-) in these cells. The PMCA2(+/-) cerebellum expressed half the normal levels of PMCA2 and this nearly doubled the time taken for PN dendritic calcium transients to recover (mean fast and slow recovery times increased from 70 ms to 110 ms and from 600 ms to 1100 ms). The slower calcium recovery had distinct consequences for PMCA2(+/-) PN physiology. The PNs exhibited weaker climbing fibre responses, prolonged outward Ca(2+)-dependent K(+) current (mean fast and slow recovery times increased from 136 ms to 192 ms and from 595 ms to 1423 ms) and a slower mean frequency of action potential firing (7.4 Hz compared with 15.8 Hz). Our findings were consistent with prolonged calcium accumulation in the cytosol of PMCA2(+/-) Purkinje neurones. Although PMCA2(+/-) mice exhibited outwardly normal behaviour and little change in their gait pattern, when challenged to run on a narrow beam they exhibited clear deficits in hindlimb coordination. Training improved the motor performance of both PMCA2(+/-) and wild-type mice, although PMCA2(+/-) mice were always impaired. We conclude that reduced calcium clearance perturbs calcium dynamics in PN dendrites and that this is sufficient to disrupt the accuracy of cerebellar processing and motor coordination.


Figures

Figure 1
Figure 1. PMCA2 expression is approximately halved in PMCA2+/− mouse cerebellum with little change in gross structure of the cerebellum or PNs
A, sagittal sections from mouse cerebellum labelled with calbindin (green) and PMCA2 (red) in wild-type PMCA2+/+, heterozygous PMCA2+/− and homozygous knockout PMCA2−/− mice granule cell (GCL) and molecular layers (ML). The insets show a higher resolution image of Purkinje neurone soma where the characteristic plasma membrane location of the PMCA2 is visible in PMCA2+/+ PNs. PMCA2 was still detectable by immunohistochemistry in the PMCA2+/− cerebellum but less than wild-type expression, and as expected not detectable at all in PMCA2−/− cerebellum. Calbindin was present in all PN dendrites and shows the stunted and disordered structure of the PMCA2−/− PN dendrites (see right-hand panel). Camera and filter settings were identical between sections for both fluorophores. B, semi-quantitative Western blotting shows PMCA2 expression to be approximately halved in the PMCA2+/− mouse cerebellum, as indicated by a representative blot in the top panel, where calbindin expression and tubulin expression as loading controls are shown for the same samples, from the same blot and film. Horizontal bars represent the positions of molecular mass markers at 198.4, 38.2 and 31.3 kDa.
Figure 2
Figure 2. Climbing fibre-induced calcium transients and electrical responses were reduced in amplitude and the two phases of recovery of the calcium transient both slowed in PNs with reduced PMCA2 expression
A, PN from a PMCA2+/− mouse filled with 100 μm OGB-1 (left-hand panel) where a white bar indicates the approximate position of the linescan. The x–t plot of fluorescence change in response to CF activation is shown simultaneously with the electrophysiological voltage-clamp response (above, with the higher time resolution of the typical CF-induced inward current shown in the top panel). Below the x–t plot is the profile of the fluorescence (F; a.u., arbitrary units) change during the CF stimulation; note the sharp increase in fluorescence and its subsequent recovery, best fitted in the profile below, with a double exponential fit (continuous fitted line) compared with a single exponential fit (dashed line). B, average traces of fluorescence changes for all cells in the two different groups, showing the slowing of the recovery of the fluorescence-based calcium transient and the reduction in peak amplitude in the PMCA2+/− cells. Below each trace is a representative example of the CF response recorded in voltage-clamp mode, with the higher time resolution showing the repetitive spikes evoked in response to the climbing fibre stimulation. Note also the reduced number of spikelets superimposed upon the overall reduced inward current in the PMCA2+/− PN that is associated with the reduced peak amplitude of the calcium transient. Dot represents timing of application of climbing fibre stimulation. C, combined data for all cells. t1 and t2 represent the half-decay time of the first, fast, and second, slower phase of the fluorescence-based calcium transient. Error bars represent means ±s.e.m. ***Significance level at P < 0.001 (t test).
Figure 3
Figure 3. Depolarization-induced calcium transients and electrical responses were reduced in amplitude and the two phases of recovery of the calcium transient both slowed in PNs with reduced PMCA2 expression
A, PN from a PMCA2+/− mouse filled with 100 μm OGB-1 (left-hand panel) where a white bar indicates the approximate position of the linescan in the proximal PN dendrite. The x–t plot of fluorescence change in response to a 400 ms depolarization of the cell from −80 to 0 mV is shown simultaneously with the electrophysiological voltage-clamp response (above, with the higher time resolution of the early part of the depolarization response showing the spikelets in the top panel). Below the x–t plot is the profile of the fluorescence change during the depolarization; note the long and slow increase in fluorescence and its rapid curtailment as the membrane voltage is returned to −80 mV. The subsequent recovery of the calcium transient was best fitted in the profile below, with a double exponential fit (continuous fitted line) compared with a single exponential fit (dashed line). B, average traces of fluorescence changes for all cells in the two different groups, showing the slowing of the calcium transient and the reduction in their peak amplitudes. Below each trace is a representative example of the electrophysiological voltage-clamp response, with the higher time resolution showing the early response to depolarization for a representative cell. Note the reduced number of spikelets in the PMCA2+/− mice associated with the reduced peak amplitude of the calcium transient (right-hand traces). C, combined data for all cells. t1 and t2 represent the half-decay time of the first, fast, and second, slower phases of the fluorescence transient, both showing a progressive increase in decay time as PMCA2 expression is reduced. Error bars represent means ±s.e.m. ***Significance at P < 0.001 (t test).
Figure 4
Figure 4. Depolarization-induced slow calcium-dependent outward currents decayed with two phases of recovery both of which were slowed in PNs with reduced PMCA2 expression
A, depolarization-induced currents for each of PCMA2+/+ (left) and PMCA2+/− (right), in response to a depolarization from a holding potential of −80 to 0 mV for a duration of 400 ms before returning to −80 mV. The insets show the outward current observable at the end of the depolarizing pulse, shown in a representative manner by the upper thick black line. This current recovered to baseline in a manner best fitted with a double exponential. t1 and t2 numbers next to the trace indicate the first and second time constants for recovery for the trace shown. Traces are averages of at least 3 traces. Dotted lines represent the baseline current. B and C, combined data for all cells for t1 and t2, respectively, that represent the half-decay time of the first, fast, and second, slower phase of the recovery of the outward current, both showing an increase in decay time with reduced PMCA2 expression. Error bars represent means ±s.e.m. Significance levels: **P < 0.01 and *P < 0.05 (t test).
Figure 5
Figure 5. Carboxyeosin, a pharmacological inhibitor of PMCA slowed both phases of the recovery of depolarization-induced calcium transients and outward currents in PNs from PMCA2+/+ mice
A, responses from a single PN before and after (left and right panels, respectively) treatment with 10 μm carboxyeosin (CE). The first x–t representation of the fluorescence-based calcium transient was recorded just before application of CE at 39 min after establishing the whole-cell patch-clamp configuration and the region of the dendrites was similar to the positions previously shown (e.g. Figs 2 and 3); the change in response in the same set of dendrites, following CE application, was recorded 11 min later, at 50 min. Below the x–t fluorescence traces the profile for the fluorescence change is shown, together with the outward current following the depolarization in the lower panel of each of the left and right panels. Dotted lines represent baseline current. B and C, combined data from all cells. B shows the change in both the fast and slow decay times of the calcium transient before and after CE (filled versus open bars) and C shows that the two phases of recovery of the outward current follow a similar pattern. Error bars represent means ±s.e.m. Significance levels: ***P < 0.001 and *P < 0.05 in paired t test comparisons before and after the application of CE.
Figure 6
Figure 6. Reduced frequency of spontaneous action potential firing from PNs with reduced PMCA2 expression
A, representative traces from wild-type PMCA2+/+ and heterozygous PMCA2+/− PNs where each spike event represents an extracellularly recorded action potential. Note that in all cells interspike intervals were irregular to some extent. In B the combined data for the mean instantaneous frequency (inst freq) in Hz is shown for all cells. ***Significance at P < 0.001 (t test). C, the distribution of instantaneous frequency for all cells in PMCA2+/+ and PMCA2+/− groups indicate a similar spread of frequencies across the groups. Frequency values are binned at intervals of 1 Hz.
Figure 7
Figure 7. PMCA2+/+ and PMCA2+/− mice displayed a similar walking gait but the PMCA2+/− mice performed poorly on the beam test
A, representative examples of footprint sequences from PMCA2+/+ and PMCA2+/− mice, where red and green represent right and left prints respectively, with rear prints represented by the lighter shading. Note very little difference between the two mice. For a more detailed analysis of the gait parameters see online Supplemental Fig. 3. B shows that both young and pre-trained older mice negotiated a 1 m beam but exhibited a reduced number of hindlimb slips as they crossed the beam during daily trials over 1–8 days. PMCA2+/− mice (red symbols), however, performed less well making more slips throughout the training period. Error bars represent means ±s.e.m. Both data sets differed significantly in a two-way ANOVA revealing significant interactions at P < 0.001 (***) in terms of days of training within the groups and with respect to the two different genotypes. C shows the significantly slower time taken to traverse the beam by the PMCA2+/− mice in both the young, 1-month-old, and older, 2-month-old mice. Note the shorter crossing time in the young versus older PMCA2+/+ mice. *Significance at P < 0.05 (t test).

Similar articles

Cited by

References

    1. Airaksinen MS, Eilers J, Garaschuk O, Thoenen H, Konnerth A, Meyer M. Ataxia and altered dendritic calcium signalling in mice carrying a targeted null mutation of the calbindin D28k gene. Proc Natl Acad Sci U S A. 1997;94:1488–1493. - PMC - PubMed
    1. Aponte Y, Bischofberger J, Jonas P. Efficient Ca2+ buffering in fast-spiking basket cells of rat hippocampus. J Physiol. 2008;586:2061–2075. - PMC - PubMed
    1. Barski JJ, Hartmann J, Rose CR, Hoebeek F, Mörl K, Noll-Hussong M, De Zeeuw CI, Konnerth A, Meyer M. Calbindin in cerebellar Purkinje cells is a critical determinant of the precision of motor coordination. J Neurosci. 2003;23:3469–3477. - PMC - PubMed
    1. Berridge MJ, Bootman MD, Roderick HL. Calcium signalling: dynamics, homeostasis and remodelling. Nat Rev Mol Cell Biol. 2003;4:517–529. - PubMed
    1. Berrocal M, Marcos D, Sepúlveda MR, Pérez M, Avila J, Mata AM. Altered Ca2+ dependence of synaptosomal plasma membrane Ca2+-ATPase in human brain affected by Alzheimer's disease. FASEB J. 2009;23:1826–1834. - PubMed