. 2010 Jan 15;24(2):195-205.
doi: 10.1101/gad.553410.

KSHV-encoded miRNAs target MAF to induce endothelial cell reprogramming

Affiliations

KSHV-encoded miRNAs target MAF to induce endothelial cell reprogramming

Amy Hansen et al. Genes Dev. .

Abstract

Kaposi sarcoma herpesvirus (KSHV) induces transcriptional reprogramming of endothelial cells. In particular, KSHV-infected lymphatic endothelial cells (LECs) show an up-regulation of genes associated with blood vessel endothelial cells (BECs). Consequently, KSHV-infected tumor cells in Kaposi sarcoma are poorly differentiated endothelial cells, expressing markers of both LECs and BECs. MicroRNAs (miRNAs) are short noncoding RNA molecules that act post-transcriptionally to negatively regulate gene expression. Here we validate expression of the KSHV-encoded miRNAs in Kaposi sarcoma lesions and demonstrate that these miRNAs contribute to viral-induced reprogramming by silencing the cellular transcription factor MAF (musculoaponeurotic fibrosarcoma oncogene homolog). MAF is expressed in LECs but not in BECs. We identify a novel role for MAF as a transcriptional repressor, preventing expression of BEC-specific genes, thereby maintaining the differentiation status of LECs. These findings demonstrate that viral miRNAs could influence the differentiation status of infected cells, and thereby contribute to KSHV-induced oncogenesis.


Figures
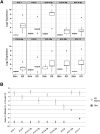
Figure 1.
Figure 1.
KSHV miRNA expression in KS. (A) Microarray log2 expression value of significantly expressed miRNA in KS biopsies (relative to KSHV-negative skin, P < 0.05). Box plots show the median, interquartile boxes, 95th percentile range, and outliers as points. Five AIDS-KS biopsies and three KSHV-negative reference skin samples were profiled. (B) qRT–PCR confirmation of the miRNA profiling data. All miRNAs assayed were expressed at higher levels in KS lesions compared with normal skin. Values were normalized to RNU66. The ΔCt represents the difference in threshold detection cycle between RNU66 and viral miRNA. Viral miRNAs were undetectable in skin biopsies.
Figure 2.
Figure 2.
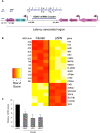
(A) Schematic representation of KSHV miRNA organization in the latency-associated region of the viral genome. The KSHV miRNAs are indicated by horizontal blue lines with the genomic locations noted below. Individual KSHV miRNA hairpins are shown above. Promoters are represented by dark-purple arrows, and protein-coding ORFs are shown in pink. The kaposin ORF is preceded by two sets of direct repeats (blue rectangles, DR1 and DR2). (B) Heat map of deregulated probes after transduction of LECs with either the KSHV miRNA cluster or empty vector (pSIN) 72 h post-infection. For all down-regulated probes (shown in red), a cumulative interaction score for the expressed KSHV miRNAs is shown (ddG sum). This set of most significantly different genes has a false discovery rate (Q value) of 0.13. The Z-score scale shows mean-scaled and 0-centered log2 GEM expression values for each row. (C) mRNA down-regulation of the top three cellular genes identified in B, in LECs transduced with the miRNA cluster confirmed by qRT–PCR. Expression is relative to empty vector, pSIN. (*) P < 0.01; (**) P < 0.001.
Figure 3.
Figure 3.
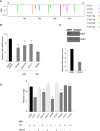
MAF is a KSHV miRNA target. (A) The positions of energetically favorable predicted seed site interactions of expressed KSHV miRNAs are shown for the MAF 3′UTR. On the Y-axis (ddG), the length of each line corresponds to the predicted strength of individual interactions: the more negative the value, the more energetically favorable the interaction. (B) MAF mRNA is down-regulated in the presence of the miRNA cluster, miR-K12-6, and miR-K12-11 (72 h post-infection), and in 293 cells stably expressing the cluster. All values are normalized to GAPDH. Relative to empty vector in the respective cell type, P < 0.05 (*) and P < 0.005 (**). (C) Western blot analysis of MAF and loading control actin in LECs transduced with either miRNA cluster or pSIN (48 h post-infection). Quantification of relative intensity was performed by Scion Image software. (D) KSHV miRNA-induced repression of the MAF 3′UTR. KSHV miRNAs were cotransfected with a MAF 3′UTR luciferase reporter plasmid. Either wild-type or mutated MAF 3′UTR was transfected. Mutated UTRs had the seed region of the corresponding miRNA disrupted by site-directed mutagenesis. The ratio of renilla to firefly luciferase relative light units was normalized to empty vector (pSIN) and the relative change is shown. Relative to pSIN cotransfected with wild-type MAF 3′UTR, P < 0.05 (*) and P < 0.005 (**).
Figure 4.
Figure 4.
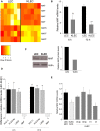
MAF is down-regulated during primary KSHV infection. (A) MAF mRNA was down-regulated in LECs 72 h post-KSHV infection (KLEC). The heat map shows the Z-score of the GEM data in which each normalized expression value is divided by the mean and centered around 0 (n = 6). Down-regulated probes are shown in red, and up-regulated probes are shown in yellow. (B) MAF mRNA down-regulation at 6 and 72 h post-KSHV infection of LECs, as quantified by qRT–PCR. Relative to noninfected LECs at the equivalent time point, P < 0.05 (*) and P < 0.001 (**). (C) Western blot analysis of MAF and loading control actin protein in noninfected and KSHV-infected LECs (KLEC; 48 h post-infection). Quantification of relative intensity was performed by Scion Image software. (D) The graph shows the relative change in expression of each gene before (LEC) and after KSHV infection of LECs (KLEC) at 6 and 72 h post-infection. KSHV viral gene expression was confirmed by qRT–PCR for LANA. Expression is relative to GAPDH; the bars show the average (n = 3) difference in relative expression between LECs and KLECs (ΔΔCt = ΔCt LEC − ΔCt KLEC). (*) P < 0.001; (**) P < 0.005. (E) Inhibition of miR-K12-6 and miR-K12-11 attenuates MAF silencing. LECs were infected with KSHV in the presence of LNA inhibitors against miR-K12-11, miR-K12-6-3p, miR-K12-6-5p, miR-K12-8, or a nontargeting control (NTC). MAF mRNA is significantly reduced in the presence of a NTC or miR-K12-8, a nontargeting KSHV miRNA. When miR-K12-11 and both mature isoforms of miR-K12-6 were inhibited, KSHV infection failed to induce MAF down-regulation. Error bars correspond to standard error. (*) P < 0.05.
Figure 5.
Figure 5.
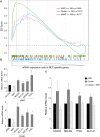
MAF down-regulation contributes to transcriptional reprogramming of LECs. (A) GSEA demonstrates a significant enrichment of BEC markers in three different GEM experiments: LECs infected with KSHV (KLEC, green line), LECs transfected with siRNA against MAF (siMAF, blue), and LECs infected with the KSHV miRNA cluster (pink). We tested several lists of the topmost BEC markers (top 50, 100, 150, 200, 250, 300) and plotted the most significant list for each experiment. All curves display a similar skewed distribution to the right, indicating increased expression. Vertical lines below the plots represent BEC-specific probes. Hatched lines represent the leading-edge gene set for each experiment. The significance calculation shown (q) is a false discovery rate. (B) qRT–PCR analysis confirmed the up-regulation of candidate MAF target genes identified by GSEA. MAF down-regulation by siRNA and miRNA cluster is shown (light-gray bars). All values were normalized to GAPDH. In each condition, expression is relative to the corresponding control siCON or pSIN. (*) P < 0.05; (**) P < 0.005. (C) Exogenous MAF lacking the 3′UTR suppressed miRNA cluster-induced up-regulation of candidate MAF target genes. MAF target genes were up-regulated in LECs transduced with the KSHV miRNA cluster as confirmed by qRT–PCR (dark-gray bars). Coinfection with cluster and lentivirus expressing the MAF ORF abolished this up-regulation (light-gray bars). The experiment was performed three times; a representative experiment is shown. Comparing KSHV cluster to pSIN, P < 0.05 (*) and P < 0.005 (**). Differences between LECs transduced with cluster plus MAF and pSIN were not significant.
Figure 6.
Figure 6.
MAF represses BEC markers. (A) In BECs, exogenous MAF represses MAF target genes. qRT–PCR analysis of BEC marker genes in BECs transduced with pSIN or MAF lentivirus. Values normalized to GAPDH and relative to empty vector, pSIN. (*) P < 0.05; (**) P < 0.005. (B) Western blot analysis of MAF and loading control actin protein in LECs transduced with either empty lentiviral vector (pSIN) or MAF--expressing lentivirus (MAF).
Figure 7.
Figure 7.
KSHV miRNAs contribute to LEC reprogramming. MAF represses the transcription of BEC marker genes in LECs (blue cell). BEC markers, but not MAF, are expressed in BECs (red cell). Upon KSHV infection and expression of the viral miRNAs, MAF is silenced (purple cell), leading to increased expression of BEC marker genes. The resulting KSHV-infected LEC is more similar to BECs than a noninfected cell. BEC marker gene names are shown in blue.

Similar articles

Cited by

References

    1. Aziz A, Soucie E, Sarrazin S, Sieweke MH. MafB/c-Maf deficiency enables self-renewal of differentiated functional macrophages. Science. 2009;326:867–871. - PubMed
    1. Baek D, Villen J, Shin C, Camargo FD, Gygi SP, Bartel DP. The impact of microRNAs on protein output. Nature. 2008;455:64–71. - PMC - PubMed
    1. Bartel DP. MicroRNAs: Target recognition and regulatory functions. Cell. 2009;136:215–233. - PMC - PubMed
    1. Bixel MG, Adams RH. Master and commander: Continued expression of Prox1 prevents the dedifferentiation of lymphatic endothelial cells. Genes & Dev. 2008;22:3232–3235. - PubMed
    1. Boshoff C, Weiss R. AIDS-related malignancies. Nat Rev Cancer. 2002;2:373–382. - PubMed

Publication types

MeSH terms