Evolution in health and medicine Sackler colloquium: Stochastic epigenetic variation as a driving force of development, evolutionary adaptation, and disease
- PMID: 20080672
- PMCID: PMC2868296
- DOI: 10.1073/pnas.0906183107
Evolution in health and medicine Sackler colloquium: Stochastic epigenetic variation as a driving force of development, evolutionary adaptation, and disease
Abstract
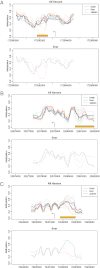
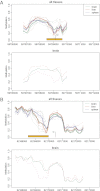
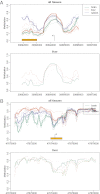
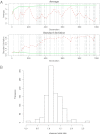
Neo-Darwinian evolutionary theory is based on exquisite selection of phenotypes caused by small genetic variations, which is the basis of quantitative trait contribution to phenotype and disease. Epigenetics is the study of nonsequence-based changes, such as DNA methylation, heritable during cell division. Previous attempts to incorporate epigenetics into evolutionary thinking have focused on Lamarckian inheritance, that is, environmentally directed epigenetic changes. Here, we propose a new non-Lamarckian theory for a role of epigenetics in evolution. We suggest that genetic variants that do not change the mean phenotype could change the variability of phenotype; and this could be mediated epigenetically. This inherited stochastic variation model would provide a mechanism to explain an epigenetic role of developmental biology in selectable phenotypic variation, as well as the largely unexplained heritable genetic variation underlying common complex disease. We provide two experimental results as proof of principle. The first result is direct evidence for stochastic epigenetic variation, identifying highly variably DNA-methylated regions in mouse and human liver and mouse brain, associated with development and morphogenesis. The second is a heritable genetic mechanism for variable methylation, namely the loss or gain of CpG dinucleotides over evolutionary time. Finally, we model genetically inherited stochastic variation in evolution, showing that it provides a powerful mechanism for evolutionary adaptation in changing environments that can be mediated epigenetically. These data suggest that genetically inherited propensity to phenotypic variability, even with no change in the mean phenotype, substantially increases fitness while increasing the disease susceptibility of a population with a changing environment.
Conflict of interest statement
The authors declare no conflict of interest.
Figures


Similar articles
-
Role of environmentally induced epigenetic transgenerational inheritance in evolutionary biology: Unified Evolution Theory.Environ Epigenet. 2021 Oct 30;7(1):dvab012. doi: 10.1093/eep/dvab012. eCollection 2021. Environ Epigenet. 2021. PMID: 34729214 Free PMC article. Review.
-
Empirical evidence for epigenetic inheritance driving evolutionary adaptation.Philos Trans R Soc Lond B Biol Sci. 2021 Jun 7;376(1826):20200121. doi: 10.1098/rstb.2020.0121. Epub 2021 Apr 19. Philos Trans R Soc Lond B Biol Sci. 2021. PMID: 33866813 Free PMC article. Review.
-
Environmental Epigenetics and a Unified Theory of the Molecular Aspects of Evolution: A Neo-Lamarckian Concept that Facilitates Neo-Darwinian Evolution.Genome Biol Evol. 2015 Apr 26;7(5):1296-302. doi: 10.1093/gbe/evv073. Genome Biol Evol. 2015. PMID: 25917417 Free PMC article. Review.
-
Epigenetic variation creates potential for evolution of plant phenotypic plasticity.New Phytol. 2013 Jan;197(1):314-322. doi: 10.1111/nph.12010. Epub 2012 Nov 1. New Phytol. 2013. PMID: 23121242
-
Generational stability of epigenetic transgenerational inheritance facilitates adaptation and evolution.Epigenetics. 2024 Dec;19(1):2380929. doi: 10.1080/15592294.2024.2380929. Epub 2024 Aug 5. Epigenetics. 2024. PMID: 39104183 Free PMC article. Review.
Cited by
-
Genetic Determinants of Epigenetic Patterns: Providing Insight into Disease.Mol Med. 2015 Mar 26;21(1):400-9. doi: 10.2119/molmed.2015.00001. Mol Med. 2015. PMID: 25822796 Free PMC article.
-
Bridging epigenomics and complex disease: the basics.Cell Mol Life Sci. 2013 May;70(9):1609-21. doi: 10.1007/s00018-013-1299-z. Epub 2013 Mar 6. Cell Mol Life Sci. 2013. PMID: 23463237 Free PMC article. Review.
-
Reprogramming cellular identity for regenerative medicine.Cell. 2012 Mar 16;148(6):1110-22. doi: 10.1016/j.cell.2012.02.031. Cell. 2012. PMID: 22424223 Free PMC article.
-
From promises to practical strategies in epigenetic epidemiology.Nat Rev Genet. 2013 Aug;14(8):585-94. doi: 10.1038/nrg3405. Epub 2013 Jul 2. Nat Rev Genet. 2013. PMID: 23817309 Review.
-
Prions are a common mechanism for phenotypic inheritance in wild yeasts.Nature. 2012 Feb 15;482(7385):363-8. doi: 10.1038/nature10875. Nature. 2012. PMID: 22337056 Free PMC article.
References
-
- Weiss KM. The smallest grain in the balance. Evol Anthropol. 2004;13:122–126.
-
- Barton NH, Briggs DEG, Eisen JA, Goldstein DB, Patel NH. Evolution. Cold Spring Harbor, NY: Cold Spring Harbor Lab Press; 2007.
-
- Goldstein DB. Common genetic variation and human traits. N Engl J Med. 2009;360:1696–1698. - PubMed
-
- Jablonka E, Lamb MJ. Epigenetic Inheritance and Evolution: The Lamarckian Dimension. New York: Oxford University Press; 1995.
-
- Cooney CA, Dave AA, Wolff GL. Maternal methyl supplements in mice affect epigenetic variation and DNA methylation of offspring. J Nutr. 2002;132(Suppl 8):2393S–2400S. - PubMed
Publication types
MeSH terms
Grants and funding
LinkOut - more resources
Full Text Sources
Other Literature Sources

