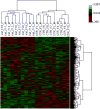
Gene expression profiling in the developing rat brain exposed to ketamine
- PMID: 20080153
- PMCID: PMC5739315
- DOI: 10.1016/j.neuroscience.2010.01.007
Gene expression profiling in the developing rat brain exposed to ketamine
Abstract
Ketamine, a non-competitive N-methyl-d-aspartate (NMDA) receptor antagonist, is associated with accelerated neuronal apoptosis in the developing rodent brain. In this study, postnatal day (PND) 7 rats were treated with 20 mg/kg ketamine or saline in six successive doses (s.c.) at 2-h intervals. Brain frontal cortical areas were collected 6 h after the last dose and RNA isolated and hybridized to Illumina Rat Ref-12 Expression BeadChips containing 22,226 probes. Many of the differentially expressed genes were associated with cell death or differentiation and receptor activity. Ingenuity Pathway Analysis software identified perturbations in NMDA-type glutamate, GABA and dopamine receptor signaling. Quantitative polymerase chain reaction (Q-PCR) confirmed that NMDA receptor subunits were significantly up-regulated. Up-regulation of NMDA receptor mRNA signaling was further confirmed by in situ hybridization. These observations support our working hypothesis that prolonged ketamine exposure produces up-regulation of NMDA receptors and subsequent over-stimulation of the glutamatergic system by endogenous glutamate, triggering enhanced apoptosis in developing neurons.
Published by Elsevier Ltd.
Figures


Similar articles
-
Potential neurotoxicity of ketamine in the developing rat brain.Toxicol Sci. 2009 Mar;108(1):149-58. doi: 10.1093/toxsci/kfn270. Epub 2009 Jan 6. Toxicol Sci. 2009. PMID: 19126600 Free PMC article.
-
Ketamine exacerbates cortical neuroapoptosis under hyperoxic conditions by upregulating expression of the N-methyl-D-aspartate receptor subunit NR1 in the developing rat brain.BMC Anesthesiol. 2018 May 10;18(1):52. doi: 10.1186/s12871-018-0511-y. BMC Anesthesiol. 2018. PMID: 29747570 Free PMC article.
-
Long-term NMDA receptor inhibition affects NMDA receptor expression and alters glutamatergic activity in developing rat hippocampal neurons.Toxicology. 2015 Jul 3;333:147-155. doi: 10.1016/j.tox.2015.04.017. Epub 2015 Apr 30. Toxicology. 2015. PMID: 25937004
-
Relationship between ketamine-induced developmental neurotoxicity and NMDA receptor-mediated calcium influx in neural stem cell-derived neurons.Neurotoxicology. 2017 May;60:254-259. doi: 10.1016/j.neuro.2016.04.015. Epub 2016 Apr 27. Neurotoxicology. 2017. PMID: 27132109 Review.
-
Systems biology approaches for toxicology.J Appl Toxicol. 2007 May-Jun;27(3):201-17. doi: 10.1002/jat.1207. J Appl Toxicol. 2007. PMID: 17265419 Review.
Cited by
-
The blockade of NMDA receptor ion channels by ketamine is enhanced in developing rat cortical neurons.Neurosci Lett. 2013 Feb 28;539:11-5. doi: 10.1016/j.neulet.2013.01.034. Epub 2013 Feb 7. Neurosci Lett. 2013. PMID: 23395831 Free PMC article.
-
Inhibition of acetylcholinesterase modulates NMDA receptor antagonist mediated alterations in the developing brain.Int J Mol Sci. 2014 Mar 3;15(3):3784-98. doi: 10.3390/ijms15033784. Int J Mol Sci. 2014. PMID: 24595240 Free PMC article.
-
Modeling anesthetic developmental neurotoxicity using human stem cells.Semin Cardiothorac Vasc Anesth. 2013 Dec;17(4):276-87. doi: 10.1177/1089253213495923. Epub 2013 Jul 16. Semin Cardiothorac Vasc Anesth. 2013. PMID: 23859832 Free PMC article. Review.
-
Ketamine-Induced Toxicity in Neurons Differentiated from Neural Stem Cells.Mol Neurobiol. 2015 Oct;52(2):959-69. doi: 10.1007/s12035-015-9248-5. Epub 2015 Jun 9. Mol Neurobiol. 2015. PMID: 26055230
-
Changes in gene expression after phencyclidine administration in developing rats: a potential animal model for schizophrenia.Int J Dev Neurosci. 2011 May;29(3):351-8. doi: 10.1016/j.ijdevneu.2010.07.234. Epub 2010 Aug 5. Int J Dev Neurosci. 2011. PMID: 20691775 Free PMC article.
References
-
- Bartanusz V, Jezova D, Bertini LT, Tilders FJ, Aubry JM, Kiss JZ. Stress-induced increase in vasopressin and corticotropin-releasing factor expression in hypophysiotrophic paraventricular neurons. Endocrinology. 1993;132:895–902. - PubMed
-
- Colwell CS, Michel S, Itri J, Rodriguez W, Tam J, Lelièvre V, Hu Z, Waschek JA. Selective deficits in the circadian light response in mice lacking PACAP. Am J Physiol Regul Integr Comp Physiol. 2004;287:R1194–R1201. - PubMed
-
- Dispersyn G, Pain L, Challet E, Touitou Y. General anesthetics effects on circadian temporal structure: an update. Chronobiol Int. 2008;25:835–850. - PubMed
Publication types
MeSH terms
Substances
Grants and funding
LinkOut - more resources
Full Text Sources

