. 2010 Jan 13;30(2):639-49.
doi: 10.1523/JNEUROSCI.4988-09.2010.

Cytoplasmic mislocalization of TDP-43 is toxic to neurons and enhanced by a mutation associated with familial amyotrophic lateral sclerosis

Affiliations

Cytoplasmic mislocalization of TDP-43 is toxic to neurons and enhanced by a mutation associated with familial amyotrophic lateral sclerosis

Sami J Barmada et al. J Neurosci. .

Abstract

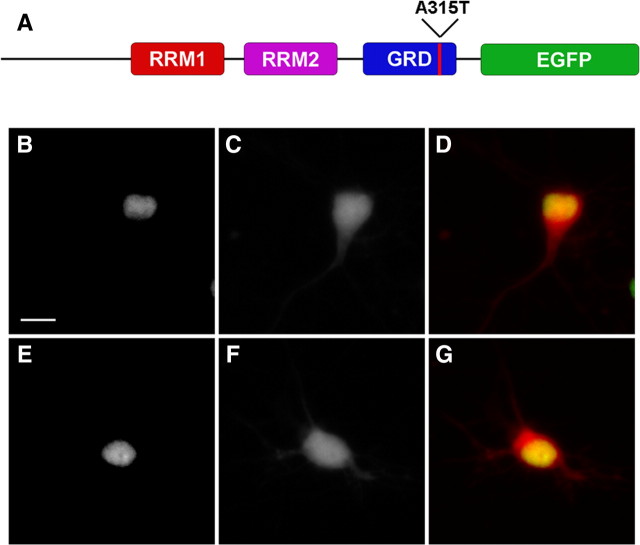
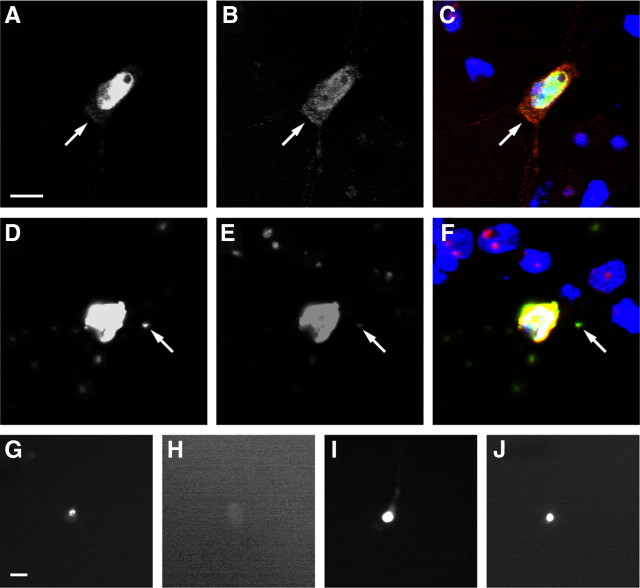
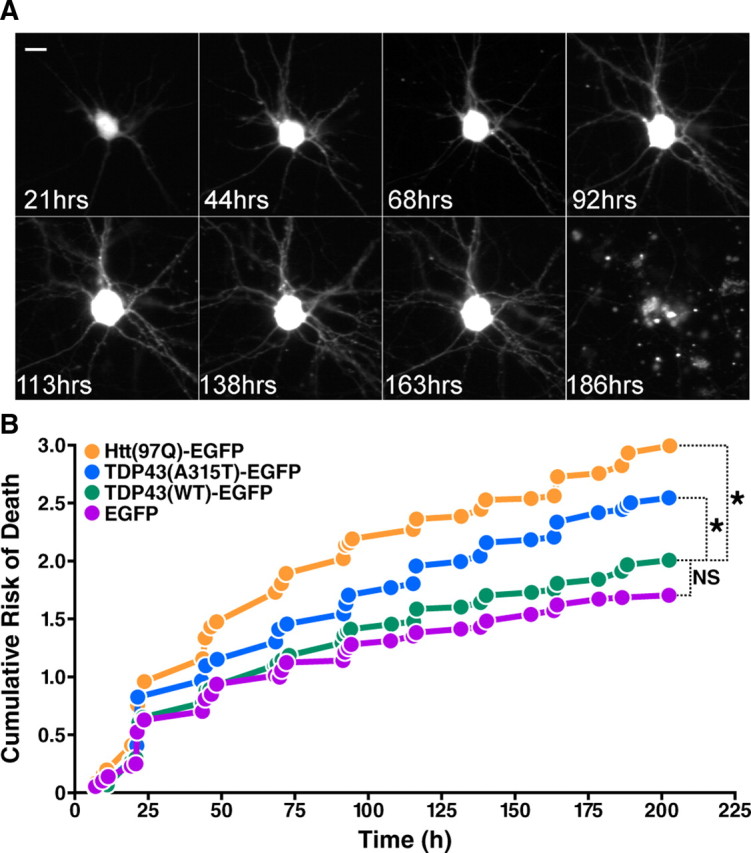
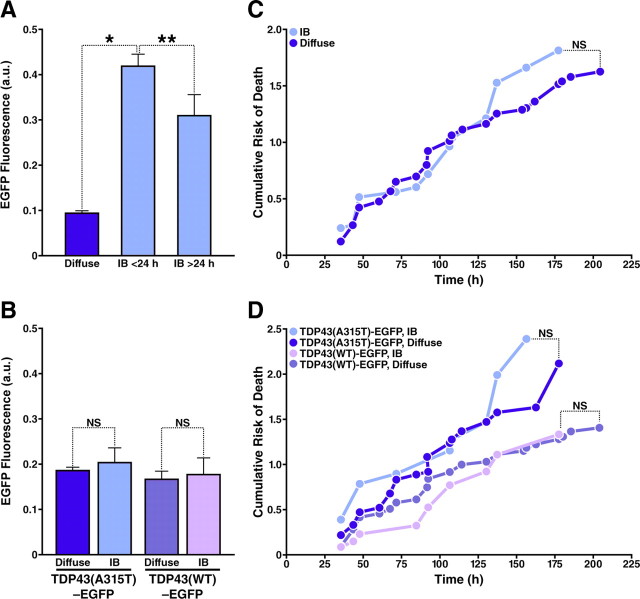
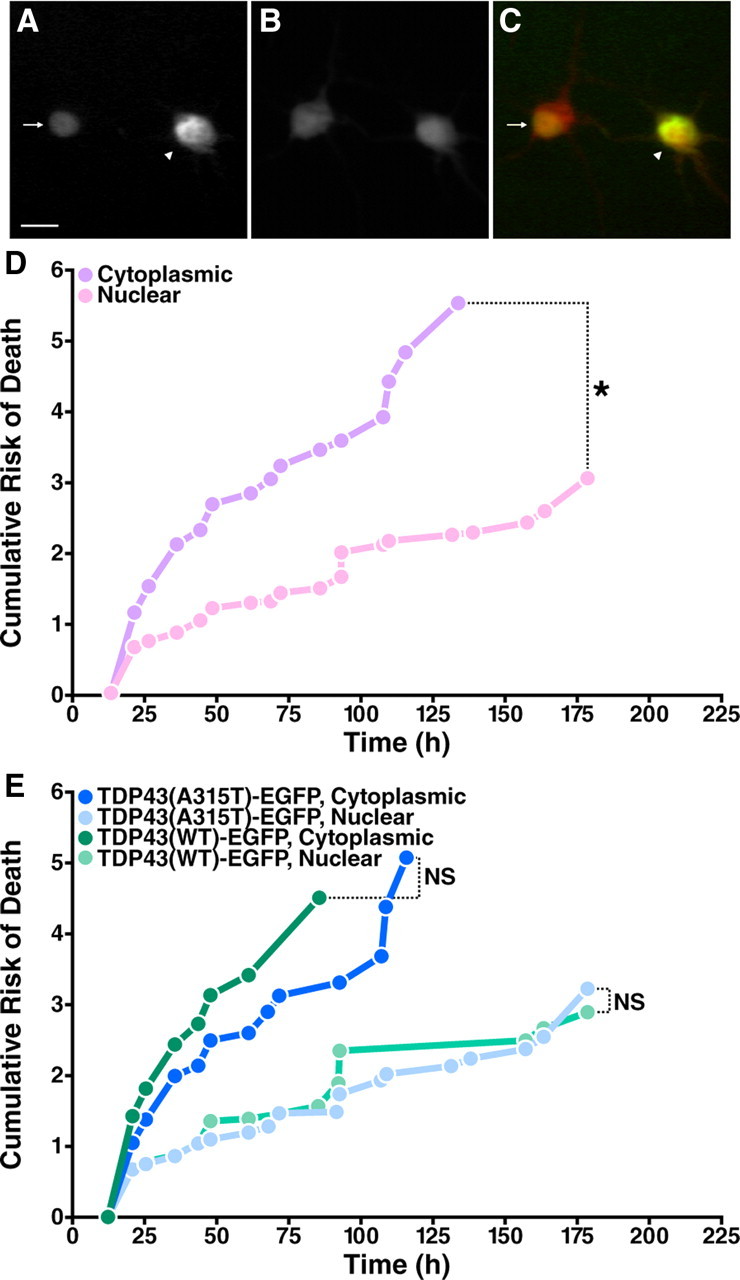
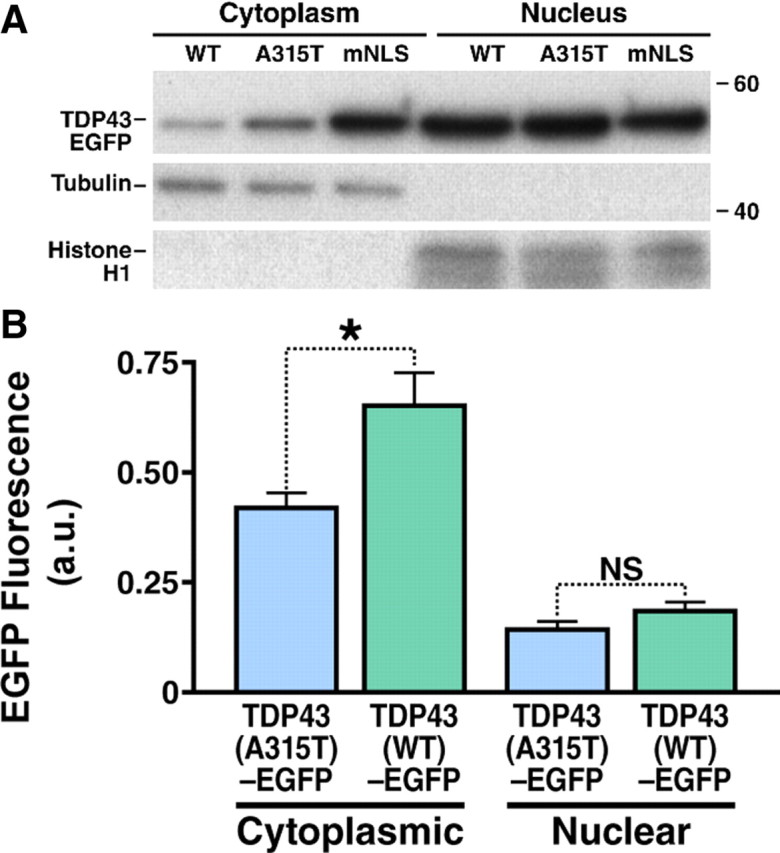
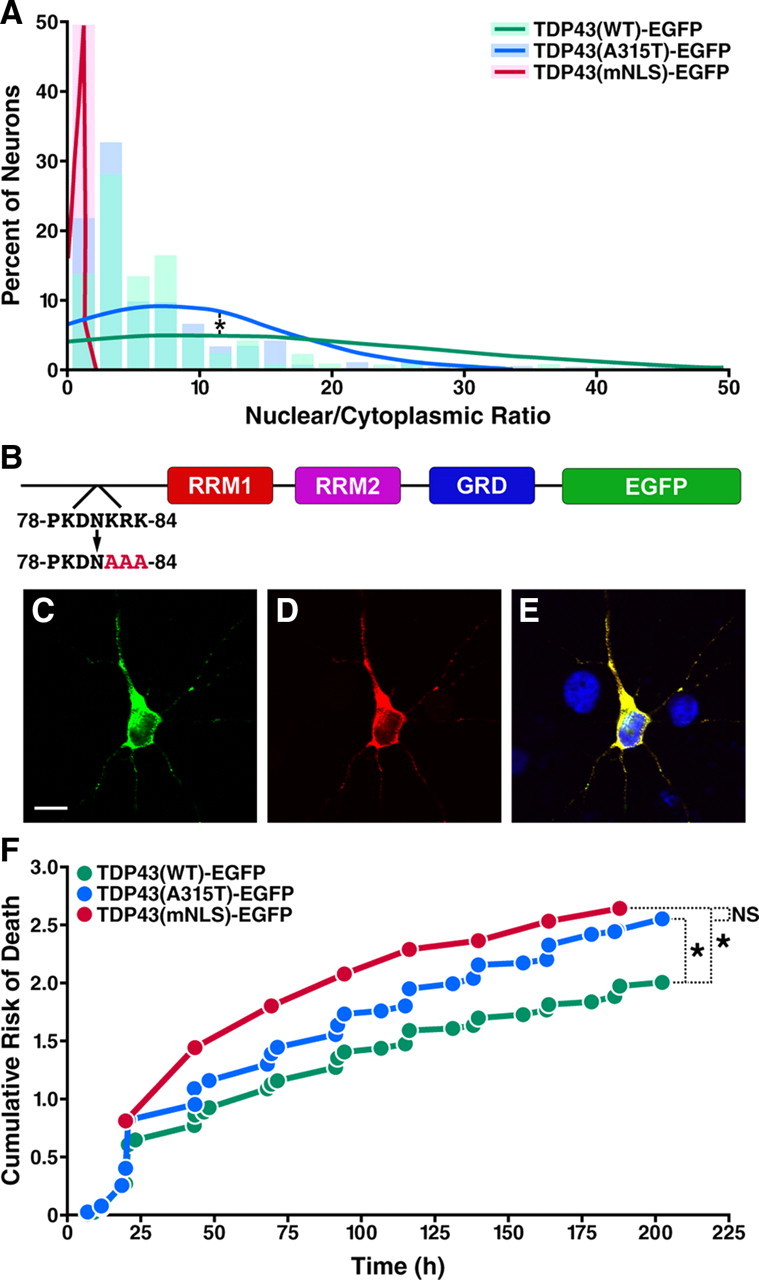
Mutations in the gene encoding TDP-43-the major protein component of neuronal aggregates characteristic of amyotrophic lateral sclerosis (ALS) and frontotemporal lobar degeneration (FTLD) with ubiquitin-positive inclusion bodies-have been linked to familial forms of both disorders. Aggregates of TDP-43 in cortical and spinal motorneurons in ALS, or in neurons of the frontal and temporal cortices in FTLD, are closely linked to neuron loss and atrophy in these areas. However, the mechanism by which TDP-43 mutations lead to neurodegeneration is unclear. To investigate the pathogenic role of TDP-43 mutations, we established a model of TDP-43 proteinopathies by expressing fluorescently tagged wild-type and mutant TDP-43 in primary rat cortical neurons. Expression of mutant TDP-43 was toxic to neurons, and mutant-specific toxicity was associated with increased cytoplasmic mislocalization of TDP-43. Inclusion bodies were not necessary for the toxicity and did not affect the risk of cell death. Cellular survival was unaffected by the total amount of exogenous TDP-43 in the nucleus, but the amount of cytoplasmic TDP-43 was a strong and independent predictor of neuronal death. These results suggest that mutant TDP-43 is mislocalized to the cytoplasm, where it exhibits a toxic gain-of-function and induces cell death.


Figures

Figure 1.
Figure 1.
TDP43-EGFP is localized to the nucleus when expressed in primary cortical neurons. A, Schematic of TDP43-EGFP showing the RNA-recognition motifs (RRMs) 1 and 2, as well as the glycine-rich domain (GRD). EGFP is fused to the C terminus of the protein. The red line denotes the approximate location of the A315T mutation. B–G, Neurons expressing TDP43(WT)-EGFP (B–D) or TDP43(A315T)-EGFP (E–G) demonstrate nuclear localization of the protein when imaged by fluorescence microscopy. B, E, EGFP fluorescence. C, F, mCherry fluorescence. D, G, Merged images with EGFP fluorescence in green, mCherry in red, and overlap in yellow. Scale bar, 10 μm.
Figure 2.
Figure 2.
Expression of TDP43-EGFP in primary cortical neurons recapitulates key features of TDP43-proteinopathies. A–C, Diffuse cytoplasmic TDP43-EGFP (arrow) was noted in a fraction of neurons expressing either WT or mutant TDP43-EGFP. D–F, Aggregates (arrow) were observed in a small proportion of neurons transfected with WT or mutant TDP43-EGFP. G–J, Detergent-resistance assay. Cells displaying aggregates were fixed and imaged using fluorescence microscopy before (G, I) and after (H, J) detergent treatment. EGFP fluorescence from TDP43(WT)-EGFP aggregates (G, H) was destroyed by detergent treatment; fluorescence from TDP43(A315T)-EGFP aggregates (I, J) was resistant. A, D, G–J, EGFP fluorescence. B, E, TDP-43 immunofluorescence. C, F, Merged images with Hoechst nuclear staining in blue, EGFP fluorescence in green, TDP-43 immunofluorescence in red, and overlap in yellow. The neurons in A–C and G and H were transfected with TDP43(WT)-EGFP; cells in D–F, I, and J were transfected with TDP43(A315T)-EGFP. Scale bars: A (for A–F), G (for G–J), 10 μm.
Figure 3.
Figure 3.
Mutant, but not WT, TDP43-EGFP is toxic when expressed in primary cortical neurons. A, A typical neuron transfected with TDP43-EGFP and mCherry and followed by automated microscopy at 12–24 h intervals until neuronal death was observed at 186 h. Scale bar, 10 μm. B, Kaplan-Meier survival analysis was used to create cumulative risk of death functions for each population of transfected neurons. In these plots, the y-axis represents a quantitative measure of the accumulated risk of cell death over time. *p < 0.0001 (log-rank test). NS, not significant (p > 0.05 by the log-rank test). The cumulative risk of death, displayed on the y-axis, represents the probability that cells in a cohort will die over the time interval for each experiment. Cumulative risk of death curves were compiled from five separate experiments, including a total of 639 neurons expressing EGFP alone, 665 neurons expressing Htt(97Q)-EGFP, 998 neurons expressing TDP43(WT)-EGFP, and 1106 neurons expressing TDP43(A315T)-EGFP.
Figure 4.
Figure 4.
IB formation is unrelated to cellular survival in neurons expressing WT and mutant TDP43-EGFP. A, Neurons with diffuse TDP43-EGFP had lower expression levels than neurons that formed IBs before or >24 h after transfection. B, C, Cohorts of neurons with IBs (n = 52) and those with diffuse TDP43-EGFP (n = 201) displaying similar expression levels (B) were analyzed by Kaplan-Meier survival analysis, and curves depicting the cumulative risk of death (C) were plotted for each population. D, Cumulative risk of death curves for neurons with IBs and those with diffuse TDP43-EGFP expressing WT (n = 149) or mutant TDP43-EGFP (n = 104). There is no significant difference in the risk of death between neurons with and without IBs, expressing either WT or mutant TDP43-EGFP. *p < 0.01; **p < 0.001; NS, not significant (p > 0.05). p values were determined by Tukey's multiple-comparison test (A, B) and log-rank test (C, D). Results represent data combined from three independent experiments.
Figure 5.
Figure 5.
Cytoplasmic TDP43-EGFP significantly increases the risk of death in transfected neurons. A–C, Cells displaying purely nuclear (arrow) or both nuclear and cytoplasmic (arrowhead) TDP43-EGFP were identified by fluorescence microscopy. A, EGFP fluorescence. B, mCherry fluorescence. C, Merged image with EGFP fluorescence in green, mCherry fluorescence in red, and overlap in yellow. Scale bar, 10 μm. D, Kaplan-Meier survival analysis of neurons with matched expression levels and either nuclear localization of TDP43-EGFP (nuclear, n = 153) or nuclear and cytoplasmic protein (cytoplasmic, n = 258), demonstrating the toxicity of cytoplasmic TDP43-EGFP. E, The toxic effect of cytoplasmic mislocalization was similar for both WT (n = 170) and mutant TDP43-EGFP (n = 241). *p < 0.0001 (log-rank test). NS, not significant (p > 0.05). Cumulative risk of death curves were constructed with data from three separate experiments.
Figure 6.
Figure 6.
Both the A315T mutation and disruption of the nuclear localization signal increase cytoplasmic mislocalization of TDP43-EGFP. A, HEK293 cells were transfected with either TDP43(WT)-EGFP, TDP43(A315T)-EGFP, and TDP43(mNLS), and cell lysate from each group was separated into cytosolic and nuclear fractions. TDP43-EGFP can be found within the nuclear fractions (marked by the presence of histone H1) of each group. After normalization, the amount of TDP43-EGFP within the cytoplasmic fraction (marked by α-tubulin) increases by a factor of 1.79 and 3.86 in cells transfected with TDP43(A315T)-EGFP and TDP43(mNLS)-EGFP, respectively, compared with those expressing TDP43(WT)-EGFP. A band migrating at 43 kDa and corresponding to endogenous TDP-43 was noted in the nuclear fraction of each lysate (data not shown). B, The mean expression level of neurons with cytoplasmic TDP43-EGFP was significantly higher in cells transfected with TDP43(WT)-EGFP than in those transfected with TDP43(A315T)-EGFP, indicating that cytoplasmic mislocalization of mutant TDP43-EGFP compared with wild-type cannot be due to relative overexpression alone. *p = 0.0008 (two-tailed t test); NS, not significant (p > 0.05). Results represent pooled data from three different experiments.
Figure 7.
Figure 7.
Mutant TDP43-EGFP is cytoplasmically mislocalized, and cytoplasmic TDP43-EGFP is sufficient to produce neurodegeneration. A, The mean NCR of TPD43-EGFP, calculated from the fluorescence intensity in the nucleus and cytoplasm of transfected cells, was lower in cells expressing mutant TDP-43-EGFP (blue, n = 261) than in those expressing WT protein (green, n = 214), consistent with the mislocalization of TDP43(A315T)-EGFP to the cytoplasm (*p = 0.003, Kolmogorov–Smirnov test). Solid lines mark the normal distribution curves for each population, and shaded regions represent the proportions of neurons with the indicated NCR values plotted as a histogram. Virtually all neurons expressing TDP43(mNLS)-EGFP (red, n = 107) had an NCR <1, confirming the predominantly cytoplasmic localization of the protein. NCR distribution curves and histograms were generated from expression data pooled from three separate experiments. B, Schematic of TDP43-EGFP highlighting the NLS encompassing residues 78–84. TDP43(mNLS)-EGFP was created by substituting nonpolar alanine residues (AAA) for the basic residues (KRK) at positions 82–84 of TDP43(WT)-EGFP. C–E, Confocal fluorescence microscopy of neurons expressing TDP43(mNLS)-EGFP, demonstrating cytoplasmic localization of the fusion protein. C, EGFP fluorescence. Scale bar, 10 μm. D, TDP43 immunostaining. E, Merged image with Hoechst nuclear staining in blue and overlap in yellow. F, Kaplan-Meier survival analysis and cumulative risk of death curves for neurons expressing TDP43(WT)-EGFP (n = 998), TDP43(A315T)-EGFP (n = 1106), and TDP43(mNLS)-EGFP (n = 732). Both TDP43(A315T)-EGFP and TDP43(mNLS)-EGFP were highly toxic in transfected cells (*p < 0.0001, log-rank test), but there was no statistically significant difference between the effects of TDP43(A315T)-EGFP and TDP43(mNLS)-EGFP on cellular survival (NS, not significant; p > 0.05, log rank test). Cumulative risk of death plots included data from five independent experiments.

Similar articles

Cited by

References

    1. Arai T, Hasegawa M, Akiyama H, Ikeda K, Nonaka T, Mori H, Mann D, Tsuchiya K, Yoshida M, Hashizume Y, Oda T. TDP-43 is a component of ubiquitin-positive tau-negative inclusions in frontotemporal lobar degeneration and amyotrophic lateral sclerosis. Biochem Biophys Res Commun. 2006;351:602–611. - PubMed
    1. Arrasate M, Finkbeiner S. Automated microscope system for determining factors that predict neuronal fate. Proc Natl Acad Sci U S A. 2005;102:3840–3845. - PMC - PubMed
    1. Arrasate M, Mitra S, Schweitzer ES, Segal MR, Finkbeiner S. Inclusion body formation reduces levels of mutant huntingtin and the risk of neuronal death. Nature. 2004;431:805–810. - PubMed
    1. Ayala YM, Zago P, D'Ambrogio A, Xu YF, Petrucelli L, Buratti E, Baralle FE. Structural determinants of the cellular localization and shuttling of TDP-43. J Cell Sci. 2008;121:3778–3785. - PubMed
    1. Benajiba L, Le Ber I, Camuzat A, Lacoste M, Thomas-Anterion C, Couratier P, Legallic S, Salachas F, Hannequin D, Decousus M, Lacomblez L, Guedj E, Golfier V, Camu W, Dubois B, Campion D, Meininger V, Brice A French Clinical and Genetic Research Network on Frontotemporal Lobar Degeneration/Frontotemporal Lobar Degeneration with Motoneuron Disease. TARDBP mutations in motoneuron disease with frontotemporal lobar degeneration. Ann Neurol. 2009;65:470–473. - PubMed

Publication types

MeSH terms

LinkOut - more resources