Haploinsufficiency of Apc leads to ineffective hematopoiesis
- PMID: 20065296
- PMCID: PMC3372947
- DOI: 10.1182/blood-2009-11-251835
Haploinsufficiency of Apc leads to ineffective hematopoiesis
Abstract
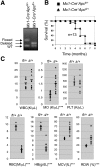
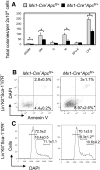
Loss of a whole chromosome 5 or a deletion of the long arm of chromosome 5, -5/del(5q), is a recurring abnormality in myeloid neoplasms. The APC gene is located at chromosome band 5q23, and is deleted in more than 95% of patients with a -5/del(5q), raising the question of whether haploinsufficiency of APC contributes to the development of myeloid neoplasms with loss of 5q. We show that conditional inactivation of a single allele of Apc in mice leads to the development of severe anemia with macrocytosis and monocytosis. Further characterization of the erythroid lineage revealed that erythropoiesis is blocked at the early stages of differentiation. The long-term hematopoietic stem cell (LT-HSC) and short-term HSC (ST-HSC) populations are expanded in Apc-heterozygous mice compared with the control littermates; however, the HSCs have a reduced capacity to regenerate hematopoiesis in vivo in the absence of a single allele of Apc. Apc heterozygous myeloid progenitor cells display an increased frequency of apoptosis, and decreased in vitro colony-forming capacity, recapitulating several characteristic features of myeloid neoplasms with a -5/del(5q). Our results indicate that haploinsufficiency of Apc impairs hematopoiesis, and raise the possibility that loss of function of APC contributes to the development of myelodysplasia.
Figures


Similar articles
-
Cell intrinsic and extrinsic factors synergize in mice with haploinsufficiency for Tp53, and two human del(5q) genes, Egr1 and Apc.Blood. 2014 Jan 9;123(2):228-38. doi: 10.1182/blood-2013-05-506568. Epub 2013 Nov 21. Blood. 2014. PMID: 24264229 Free PMC article.
-
β-Catenin Is a Candidate Therapeutic Target for Myeloid Neoplasms with del(5q).Cancer Res. 2017 Aug 1;77(15):4116-4126. doi: 10.1158/0008-5472.CAN-17-0202. Epub 2017 Jun 13. Cancer Res. 2017. PMID: 28611040 Free PMC article.
-
The Apc(min) mouse has altered hematopoietic stem cell function and provides a model for MPD/MDS.Blood. 2010 Apr 29;115(17):3489-97. doi: 10.1182/blood-2009-11-251728. Epub 2010 Mar 2. Blood. 2010. PMID: 20197553 Free PMC article.
-
Molecular dissection of the 5q deletion in myelodysplastic syndrome.Semin Oncol. 2011 Oct;38(5):621-6. doi: 10.1053/j.seminoncol.2011.04.010. Semin Oncol. 2011. PMID: 21943668 Free PMC article. Review.
-
Deletion 5q MDS: molecular and therapeutic implications.Best Pract Res Clin Haematol. 2013 Dec;26(4):365-75. doi: 10.1016/j.beha.2013.10.013. Epub 2013 Oct 16. Best Pract Res Clin Haematol. 2013. PMID: 24507813 Review.
Cited by
-
Reduction in the resident intestinal myelomonocytic cell population occurs during ApcMin/+ mouse intestinal tumorigenesis.Oncol Lett. 2021 Apr;21(4):263. doi: 10.3892/ol.2021.12524. Epub 2021 Feb 8. Oncol Lett. 2021. PMID: 33664826 Free PMC article.
-
Hematopoietic stem cell development requires transient Wnt/β-catenin activity.J Exp Med. 2012 Jul 30;209(8):1457-68. doi: 10.1084/jem.20120225. Epub 2012 Jul 16. J Exp Med. 2012. PMID: 22802352 Free PMC article.
-
Myelodysplastic syndromes: an update on molecular pathology.Clin Transl Oncol. 2010 Oct;12(10):652-61. doi: 10.1007/s12094-010-0574-9. Clin Transl Oncol. 2010. PMID: 20947479 Review.
-
Knockdown of HSPA9 induces TP53-dependent apoptosis in human hematopoietic progenitor cells.PLoS One. 2017 Feb 8;12(2):e0170470. doi: 10.1371/journal.pone.0170470. eCollection 2017. PLoS One. 2017. PMID: 28178280 Free PMC article.
-
Clonal evolution in myelodysplastic syndromes with isolated del(5q): the importance of genetic monitoring.Haematologica. 2011 Feb;96(2):177-80. doi: 10.3324/haematol.2010.038281. Haematologica. 2011. PMID: 21282717 Free PMC article. No abstract available.
References
-
- Nimer SD. Myelodysplastic syndromes. Blood. 2008;111(10):4841–4851. - PubMed
-
- Olney HJ, Le Beau, MM . Cytogenetic abnormalities in myelodysplastic syndromes. Cambridge, MA: Cambridge University Press; 2005.
-
- Haase D, Germing U, Schanz J, et al. New insights into the prognostic impact of the karyotype in MDS and correlation with subtypes: evidence from a core dataset of 2124 patients. Blood. 2007;110(13):4385–4395. - PubMed
-
- Smith SM, Le Beau MM, Huo D, et al. Clinical-cytogenetic associations in 306 patients with therapy-related myelodysplasia and myeloid leukemia: the University of Chicago series. Blood. 2003;102(1):43–52. - PubMed
-
- Giagounidis AA, Germing U, Wainscoat JS, Boultwood J, Aul C. The 5q− syndrome. Hematology. 2004;9(4):271–277. - PubMed
MeSH terms
Substances
Grants and funding
LinkOut - more resources
Full Text Sources

