. 2010 Jan 11;188(1):131-44.
doi: 10.1083/jcb.200908057.

The clathrin heavy chain isoform CHC22 functions in a novel endosomal sorting step

Affiliations

The clathrin heavy chain isoform CHC22 functions in a novel endosomal sorting step

Christopher Esk et al. J Cell Biol. .

Abstract

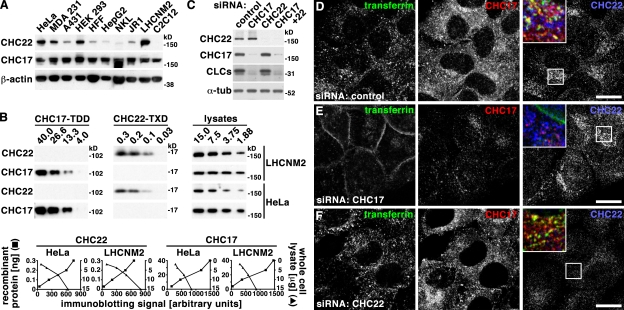
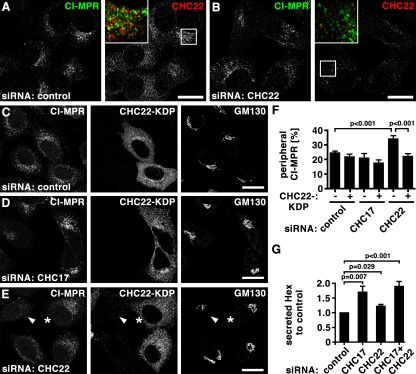
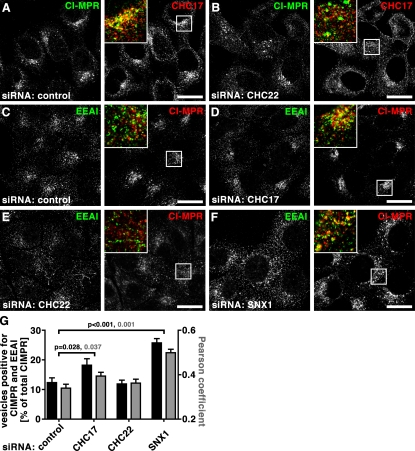
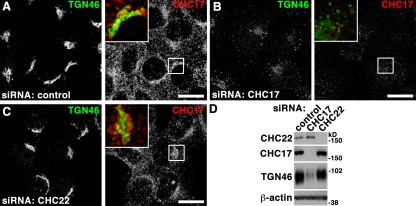
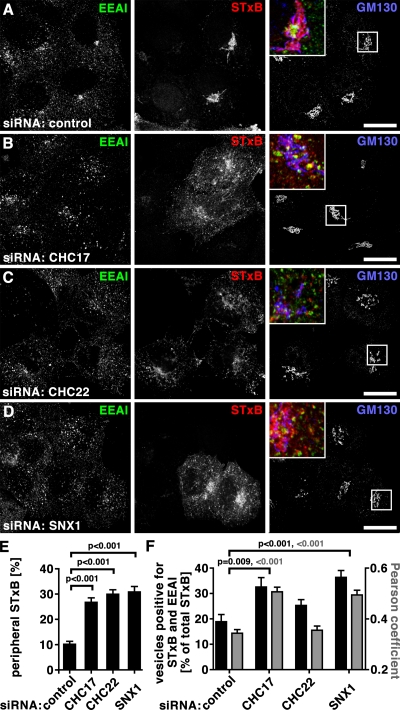
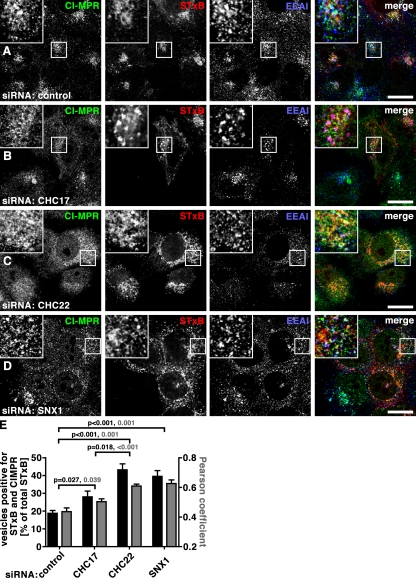
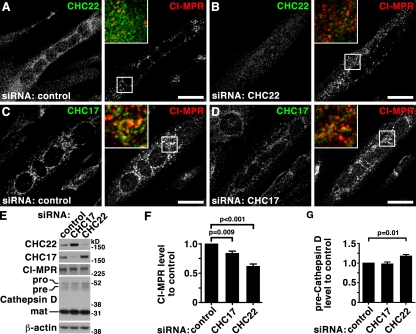
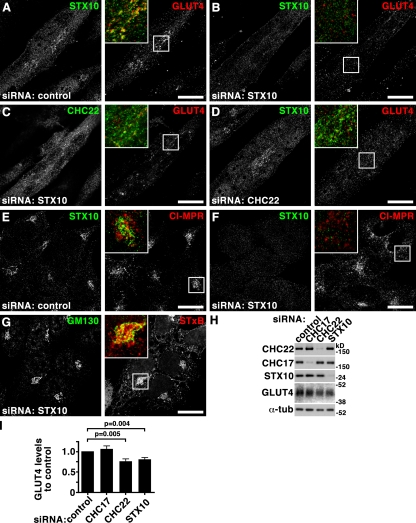
Clathrin heavy chain 22 (CHC22) is an isoform of the well-characterized CHC17 clathrin heavy chain, a coat component of vesicles that mediate endocytosis and organelle biogenesis. CHC22 has a distinct role from CHC17 in trafficking glucose transporter 4 (GLUT4) in skeletal muscle and fat, though its transfection into HEK293 cells suggests functional redundancy. Here, we show that CHC22 is eightfold less abundant than CHC17 in muscle, other cell types have variably lower amounts of CHC22, and endogenous CHC22 and CHC17 function independently in nonmuscle and muscle cells. CHC22 was required for retrograde trafficking of certain cargo molecules from endosomes to the trans-Golgi network (TGN), defining a novel endosomal-sorting step distinguishable from that mediated by CHC17 and retromer. In muscle cells, depletion of syntaxin 10 as well as CHC22 affected GLUT4 targeting, establishing retrograde endosome-TGN transport as critical for GLUT4 trafficking. Like CHC22, syntaxin 10 is not expressed in mice but is present in humans and other vertebrates, implicating two species-restricted endosomal traffic proteins in GLUT4 transport.


Figures

Figure 1.
Figure 1.
CHC22 is present at variable levels in most cell types and does not participate in endocytosis. (A) Detergent lysates of 10 tissue culture cell lines (equalized for protein content) were separated by SDS-PAGE and immunoblotted with antibodies against proteins indicated at the left. Tissue sources for the cell lines were cervical epithelium (HeLa), mammary gland epithelium (MDA 231), epidermal epithelium (A431), kidney epithelium (HEK 293), foreskin fibroblast (HFF), hepatocellular carcinoma (HepG2), natural killer lymphocyte (NKL), rhabdomyosarcoma (JR1), and skeletal muscle (LHCNM2 and C2C12), with all derived from human samples except C2C12 (mouse). (B) Indicated amounts of recombinant protein fragments (in ng) of CHC17 (amino acids 1–1074, CHC17-TDD) or CHC22 (amino acids 1521–1640, CHC22-TXD) and of detergent lysates (in µg) of HeLa or LHCNM2 cells (designated at the far right) were separated by SDS-PAGE and analyzed sequentially on the same immunoblot, after stripping in between, with antibodies against the CHC for the entire row indicated at the left. Below, each plot shows the intensity of the immunoblotting signal (x-axis) versus the amount of recombinant protein (left y-axis, solid squares) or detergent lysate (right y-axis, solid triangles) analyzed. CHC amount in cell lysates was determined by intersection with the immunoblotting signals from the recombinant fragments used for antibody calibration, adjusting for fragment length. Measured ratios for CHC22 compared with CHC17 were 1:8 for LHCNM2 and 1:12 for HeLa. (C) Detergent lysates of HeLa cells treated with siRNA to deplete CHCs indicated at the top or with control siRNA were separated by SDS-PAGE and immunoblotted with antibodies against proteins indicated at the left. α-Tubulin (α-tub) serves as a loading control. (D–F) HeLa cells treated with control siRNA (D) or siRNA to deplete cells of CHC17 (E) and CHC22 (F) were incubated with fluorescent transferrin (green in merged insets) and internalization was allowed for 10 min. Cells were then fixed and processed for double immunofluorescence using antibodies against CHC17 (red in merged insets) or CHC22 (blue in merged insets) as indicated. Bars, 20 µm.
Figure 2.
Figure 2.
Overexpression of CHC22 increases its colocalization with CHC17. (A and B) HeLa cells transfected with GFP-tagged CHC22 (GFP-CHC22, blue in merged insets) were processed for immunofluorescence and labeled for CHC17 (green in merged insets) and CHC22 (red in merged insets) as indicated. CHC22 label was imaged with microscope settings optimal for nontransfected cells (A) or transfected cells (B). Merged images of the boxed area consisting of CHC17 and CHC22 antibody labeling in the middle panels and all three signals in the right images are presented as an inset. Bars, 20 µm. (C) Vesicles containing both CHC17 and CHC22 or CHC22 only were automatically counted in nontransfected (no GFP) or transfected cells (GFP-CHC22). The percentage of vesicles containing both CHCs relative to all CHC22-positive vesicles is plotted (black bars) against the left y-axis for individual cells (n = 12 each of transfected or nontransfected cells from two independent experiments). Average percentages are shown ± SEM. Pearson’s coefficients of colocalization were determined for cells from the same experiment and plotted ± SEM (gray bars) against the right y-axis (n = 12 each of transfected or nontransfected cells from two independent experiments). P-values for respective evaluation are indicated according to color code.
Figure 3.
Figure 3.
CHC22 partially colocalizes with the endosomal marker Rab9. HeLa cells were grown on coverslips, processed for immunofluorescence, and labeled for CHC22 (red in merged insets). Simultaneous labeling was performed (green in merged insets) using mouse monoclonal antibodies against (A) EEA1 and (C) Rab9. (B) Rab11 was visualized as a GFP fusion protein after transient transfection of HeLa cells. Bars, 20 µm.
Figure 4.
Figure 4.
CHC22 depletion leads to dispersal of CI-MPR from the perinuclear region. (A and B) HeLa cells treated with control siRNA (A) or siRNA to deplete CHC22 (B) were processed for immunofluorescence and labeled for CI-MPR (green in merged insets) and CHC22 (red in merged insets) as indicated. Bars, 20 µm. (C–E) HeLa cells treated with control siRNA (C) or siRNA to deplete CHC17 (D) and CHC22 (E) were transfected with an siRNA-resistant, FLAG-tagged CHC22 construct (CHC22-KDP, knock-down proof), processed for immunofluorescence, and labeled for CI-MPR, FLAG-tag, and GM130 as indicated. In E, an asterisk marks a cell transfected with CHC22-KDP and siRNA targeting CHC22 that exhibits a normal concentration of CI-MPR in the perinuclear region, whereas an adjacent cell without CHC22-KDP (arrowhead) has dispersed CI-MPR, as in B. Bars, 20 µm. (F) For cells treated as in C–E, peripheral CI-MPR was quantified around the Golgi region (labeled with GM130) as a percentage of total CI-MPR, using the method illustrated in Fig. S4 (control cells: n = 12 for transfected and nontransfected; CHC17-depleted cells: n = 7 for nontransfected, n = 12 for transfected; CHC22-depleted cells: n = 16 for nontransfected, n = 17 for transfected; all cells from two independent experiments). Average percentages were plotted ± SEM. P-values for selected samples are indicated. (G) HeLa cells were treated with siRNAs against CHC17, CHC22, or a combination, or with control siRNA, as indicated below each bar, and hexosaminidase (Hex) activity was measured. Depicted is the ratio of extracellular to intracellular hexosaminidase activity for each treatment condition normalized to the ratio measured for control-treated cells in each experiment (n = 5, ±SEM shown). P-values for selected samples are indicated.
Figure 5.
Figure 5.
Dispersed CI-MPR shows less association with early endosomes upon CHC22 depletion than after CHC17 or SNX1 depletion. (A and B) HeLa cells treated with control siRNA (A) or siRNA targeting CHC22 (B) were processed for immunofluorescence and labeled using antibodies against CI-MPR (green in merged insets) and CHC17 (red in merged insets) as indicated. (C–F) Examples of cells quantified in G. HeLa cells treated with control siRNA (C) or siRNA to deplete cells of CHC17 (D), CHC22 (E), or SNX1 (F) were processed for immunofluorescence and labeled using antibodies against EEA1 (green in merged insets) and CI-MPR (red in merged insets) as indicated. Bars, 20 µm. (G) Vesicles containing both CI-MPR and EEA1 or only CI-MPR in cells depleted of the indicated proteins were automatically counted. The percentage of vesicles with double labeling was calculated relative to all vesicles containing CI-MPR for individual cells (n = 15 for control, n = 20 for CHC17-depleted, n = 25 for CHC22-depleted, n = 16 for SNX1-depleted cells; cells from two independent experiments). Average percentages ± SEM are shown in black against the left y-axis. Pearson coefficients of colocalization were determined for individual cells from the same experiments and plotted ± SEM (gray bars) against the right y-axis (n = 12 for each control and depletion condition, derived from two independent experiments). P-values for selected evaluation are indicated according to color code.
Figure 6.
Figure 6.
CHC17 but not CHC22 depletion affects TGN46 distribution and trafficking. (A–C) HeLa cells treated with control siRNA (A) or siRNA to deplete CHC17 (B) or CHC22 (C) were processed for immunofluorescence and labeled using antibodies against TGN46 (green in merged insets) and CHC17 (red in merged insets) as indicated. Bars, 20 µm. (D) Detergent lysates of HeLa cells treated with control siRNA or siRNA to deplete CHC17 or CHC22 as indicated at the top were separated by SDS-PAGE and immunoblotted with antibodies against the proteins indicated at the left. β-Actin serves as loading control.
Figure 7.
Figure 7.
Depletion of CHC17, CHC22, or SNX1 affects STxB trafficking. (A–D) HeLa cells were treated with control siRNA (A) or siRNA to deplete cells of CHC17 (B), CHC22 (C), or SNX1 (D). Fluorescent STxB (red in merged insets) in fresh medium was bound to cells for 30 min on ice, washed in PBS, and chased for 60 min in fresh medium at 37°C. Cells were fixed, processed for immunofluorescence, and labeled using antibodies against EEA1 (green in merged insets) and GM130 (blue in merged insets). Bars, 20 µm. (E) Peripheral STxB signal around the Golgi (detected by GM130 labeling) was determined in cells treated as in A–D. Peripheral signals were calculated as percentages of total signal from individual cells using the method illustrated in Fig. S4 (n = 20 each for control, CHC17-depleted, CHC22-depleted, and SNX1-depleted cells; cells from two independent experiments) and average percentages were plotted ± SEM. P-values for selected samples are indicated. (F) Vesicles containing both STxB and EEA1 or only STxB in cells depleted of the indicated proteins were automatically counted. The percentage of vesicles containing double labeling relative to all vesicles containing STxB was calculated for individual cells (n = 15 for control, n = 20 for CHC17-depleted, n = 25 for CHC22-depleted, n = 16 for SNX1-depleted cells; cells from two independent experiments). Average percentages are shown ± SEM in black against the left y-axis. Pearson’s coefficients of colocalization were determined for cells from the same experiments and plotted ± SEM (gray bars) against the right y-axis (n = 12 for the control and each of the depletion conditions from two independent experiments). P-values for selected evaluation are indicated according to color code.
Figure 8.
Figure 8.
Retrograde traffic of STxB and CI-MPR from endosome to TGN is differentially impaired in CHC17-, CHC22-, and SNX1-depleted cells. (A–D) HeLa cells were treated with control siRNA (A) or siRNA targeting CHC17 (B), CHC22 (C), or SNX1 (D). Fluorescent STxB (red in merged insets) in fresh medium was bound to cells for 30 min on ice, washed in PBS, and chased for 60 min in fresh medium at 37°C. Cells were fixed, processed for immunofluorescence, and labeled using antibodies against CI-MPR (green in merged insets) and EEA1 (blue in merged insets). Bars, 20 µm. (E) Vesicles containing both STxB and CI-MPR or STxB only were automatically counted in cells depleted of the indicated proteins. The percentage of vesicles containing double labeling relative to all vesicles containing STxB was calculated for individual cells (n = 15 for control, n = 20 for CHC17-depleted, n = 25 for CHC22-depleted, n = 16 for SNX1-depleted cells; cells from two independent experiments). Average percentages are shown ± SEM in black against the left y-axis. Pearson’s coefficients of colocalization were determined for cells from the same experiments and plotted ± SEM (gray bars) against the right y-axis (n = 12 for the control and each of the depletion conditions from two independent experiments). P-values for selected evaluation are indicated according to color code.
Figure 9.
Figure 9.
Effects of CHC17 and CHC22 down-regulation on CI-MPR trafficking in human myoblasts reproduce effects in HeLa cells. (A–D) LHCNM2 human skeletal muscle myoblasts were differentiated, treated with control siRNA (A and C) or siRNA targeting CHC22 (B) or CHC17 (D) and processed for immunofluorescence. Cells were double labeled using antibodies against CHC17 (green in merged insets), CHC22 (green in merged insets), and CI-MPR (red in merged insets) as indicated. Bars, 20 µm. (E) LHCNM2 cells were differentiated and treated with siRNA targeting CHC17 or CHC22 or control siRNA as indicated at the top of each lane. Whole-cell detergent lysates were separated by SDS-PAGE and immunoblotted with antibodies against the proteins indicated at the left. Immature (pro), intermediate (pre), and mature (mat) forms of Cathepsin D are indicated at the left. β-Actin serves as a loading control. (F) Quantification of CI-MPR levels in whole-cell detergent lysates from siRNA-treated cells generated as in E. Shown are levels ± SEM in the samples treated with the specific siRNA indicated under each bar compared with levels in cells treated with control siRNA in the same experiment (n = 5). P-values for selected samples are indicated. (G) Quantification of preCathepsin D levels in whole-cell detergent lysates from siRNA treated cells generated as in E. Shown are levels ± SEM in the samples treated with the specific siRNA indicated under each bar compared with levels in cells treated with control siRNA in the same experiment (n = 5). P-values for selected samples are indicated.
Figure 10.
Figure 10.
Syntaxin 10 depletion partially phenocopies CHC22 depletion and is implicated in GLUT4 sequestration. (A–D) LHCNM2 human skeletal muscle myoblasts were differentiated, treated with control siRNA (A) or siRNA targeting STX10 (B and C) or CHC22 (D), and processed for immunofluorescence. Cells were double labeled using antibodies against STX10 (A, B, and D; green in merged insets), CHC22 (C; green in merged inset), and GLUT4 (red in merged insets) as indicated. Bars, 20 µm. (E–G) HeLa cells treated with control siRNA (E) or siRNA to deplete STX10 (F and G) levels were processed for immunofluorescence and labeled for STX10 (E and F; green in merged insets) and CI-MPR (E and F; red in merged insets) as indicated at the top. In G, fluorescent STxB (red in merged inset) in fresh medium was bound to cells for 30 min on ice, washed in PBS and chased for 60 min in fresh medium at 37°C, fixed, and processed for immunofluorescence using antibodies against GM130 (green in merged insets). (H) Detergent lysates of LHCNM2 cells treated with siRNA to deplete CHC17, CHC22, or STX10 or with control siRNA as indicated at the top were separated by SDS-PAGE and immunoblotted with antibodies against the proteins indicated at the left. α-Tubulin (α-tub) serves as a loading control. (I) Quantification of GLUT4 levels in detergent lysates of siRNA-treated cells generated as in H. Shown are levels ± SEM in the samples treated with the specific siRNA indicated under each bar compared with levels in cells treated with control siRNA in the same experiment (n = 6). P-values for selected samples are indicated.

Similar articles

Cited by

References

    1. Acton S.L., Wong D.H., Parham P., Brodsky F.M., Jackson A.P. 1993. Alteration of clathrin light chain expression by transfection and gene disruption. Mol. Biol. Cell. 4:647–660 - PMC - PubMed
    1. Antonescu C.N., DÍaz M., Femia G., Planas J.V., Klip A. 2008. Clathrin-dependent and independent endocytosis of glucose transporter 4 (GLUT4) in myoblasts: regulation by mitochondrial uncoupling. Traffic. 9:1173–1190 10.1111/j.1600-0854.2008.00755.x - DOI - PubMed
    1. Arighi C.N., Hartnell L.M., Aguilar R.C., Haft C.R., Bonifacino J.S. 2004. Role of the mammalian retromer in sorting of the cation-independent mannose 6-phosphate receptor. J. Cell Biol. 165:123–133 10.1083/jcb.200312055 - DOI - PMC - PubMed
    1. Banting G., Maile R., Roquemore E.P. 1998. The steady state distribution of humTGN46 is not significantly altered in cells defective in clathrin-mediated endocytosis. J. Cell Sci. 111:3451–3458 - PubMed
    1. Benmerah A., Lamaze C. 2007. Clathrin-coated pits: vive la différence? Traffic. 8:970–982 10.1111/j.1600-0854.2007.00585.x - DOI - PubMed

Publication types