

Growth rate-dependent global effects on gene expression in bacteria
- PMID: 20064380
- PMCID: PMC2818994
- DOI: 10.1016/j.cell.2009.12.001
Growth rate-dependent global effects on gene expression in bacteria
Abstract
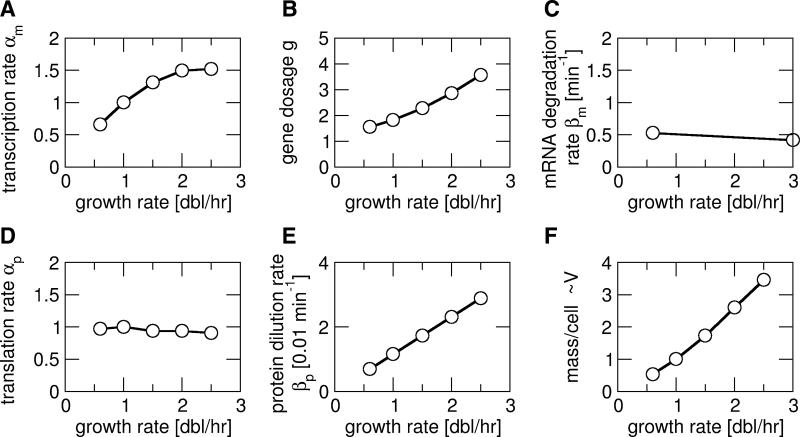
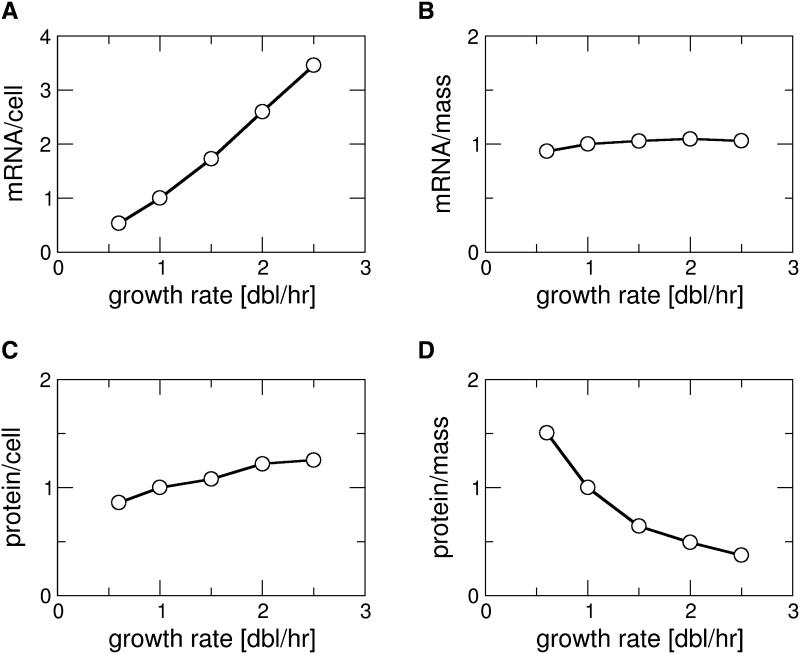
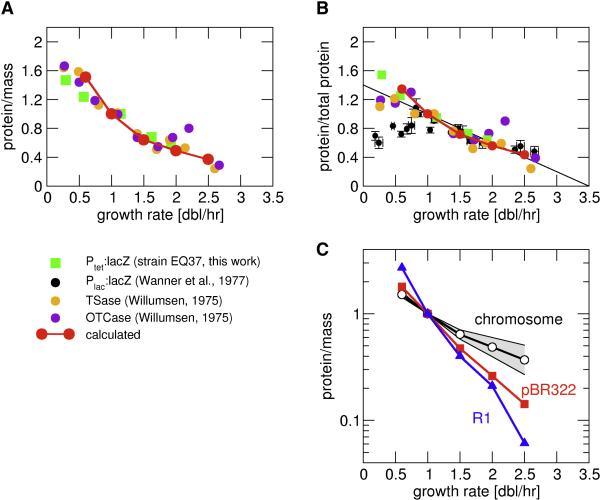
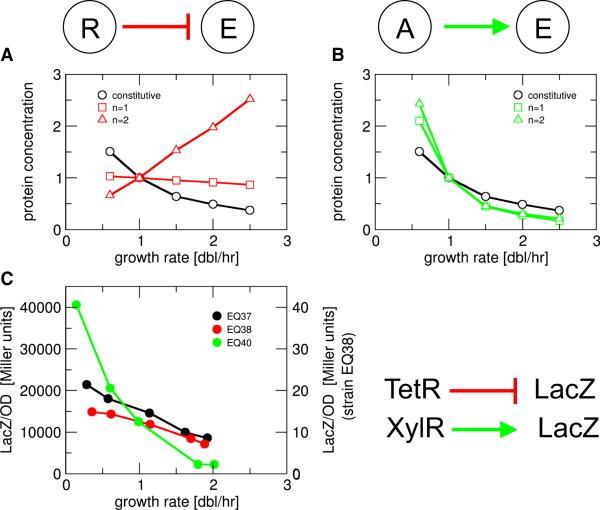
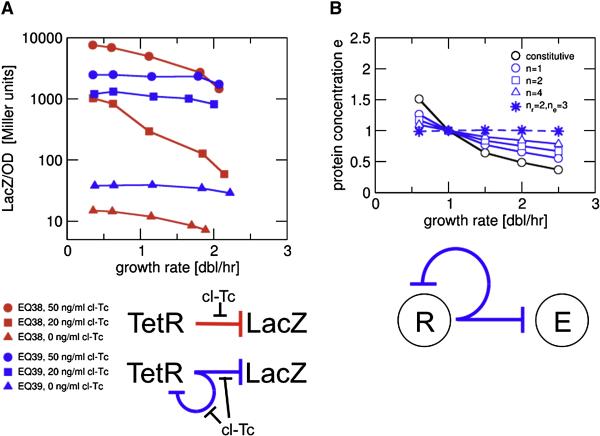
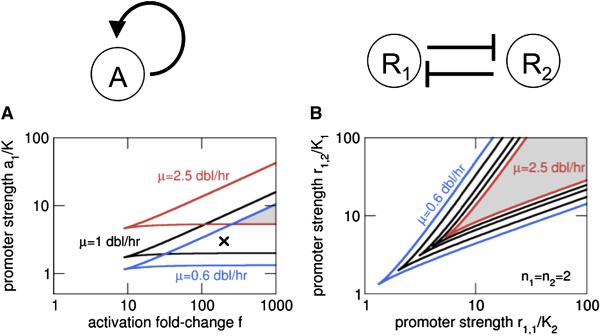
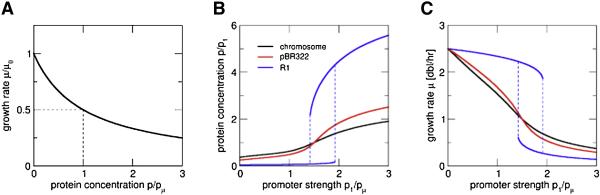
Bacterial gene expression depends not only on specific regulatory mechanisms, but also on bacterial growth, because important global parameters such as the abundance of RNA polymerases and ribosomes are all growth-rate dependent. Understanding of these global effects is necessary for a quantitative understanding of gene regulation and for the design of synthetic genetic circuits. We find that the observed growth-rate dependence of constitutive gene expression can be explained by a simple model using the measured growth-rate dependence of the relevant cellular parameters. More complex growth dependencies for genetic circuits involving activators, repressors, and feedback control were analyzed and verified experimentally with synthetic circuits. Additional results suggest a feedback mechanism mediated by general growth-dependent effects that does not require explicit gene regulation if the expressed protein affects cell growth. This mechanism can lead to growth bistability and promote the acquisition of important physiological functions such as antibiotic resistance and tolerance (persistence).
Copyright 2009 Elsevier Inc. All rights reserved.
Figures
Similar articles
-
Emergent Damped Oscillation Induced by Nutrient-Modulating Growth Feedback.ACS Synth Biol. 2021 May 21;10(5):1227-1236. doi: 10.1021/acssynbio.1c00041. Epub 2021 Apr 29. ACS Synth Biol. 2021. PMID: 33915046 Free PMC article.
-
Topology-dependent interference of synthetic gene circuit function by growth feedback.Nat Chem Biol. 2020 Jun;16(6):695-701. doi: 10.1038/s41589-020-0509-x. Epub 2020 Apr 6. Nat Chem Biol. 2020. PMID: 32251409 Free PMC article.
-
Bacterial growth: global effects on gene expression, growth feedback and proteome partition.Curr Opin Biotechnol. 2014 Aug;28:96-102. doi: 10.1016/j.copbio.2014.01.001. Epub 2014 Feb 2. Curr Opin Biotechnol. 2014. PMID: 24495512 Free PMC article. Review.
-
In vitro implementation of robust gene regulation in a synthetic biomolecular integral controller.Nat Commun. 2019 Dec 17;10(1):5760. doi: 10.1038/s41467-019-13626-z. Nat Commun. 2019. PMID: 31848346 Free PMC article.
-
DNA supercoiling - a global transcriptional regulator for enterobacterial growth?Nat Rev Microbiol. 2005 Feb;3(2):157-69. doi: 10.1038/nrmicro1088. Nat Rev Microbiol. 2005. PMID: 15685225 Review.
Cited by
-
Quantifying absolute gene expression profiles reveals distinct regulation of central carbon metabolism genes in yeast.Elife. 2021 Mar 15;10:e65722. doi: 10.7554/eLife.65722. Elife. 2021. PMID: 33720010 Free PMC article.
-
Bistability in feedback circuits as a byproduct of evolution of evolvability.Mol Syst Biol. 2012 Jan 17;8:564. doi: 10.1038/msb.2011.98. Mol Syst Biol. 2012. PMID: 22252387 Free PMC article.
-
Mapping the environmental fitness landscape of a synthetic gene circuit.PLoS Comput Biol. 2012;8(4):e1002480. doi: 10.1371/journal.pcbi.1002480. Epub 2012 Apr 12. PLoS Comput Biol. 2012. PMID: 22511863 Free PMC article.
-
A Minimalistic Resource Allocation Model to Explain Ubiquitous Increase in Protein Expression with Growth Rate.PLoS One. 2016 Apr 13;11(4):e0153344. doi: 10.1371/journal.pone.0153344. eCollection 2016. PLoS One. 2016. PMID: 27073913 Free PMC article.
-
Chromosomal Arrangement of Phosphorelay Genes Couples Sporulation and DNA Replication.Cell. 2015 Jul 16;162(2):328-337. doi: 10.1016/j.cell.2015.06.012. Epub 2015 Jul 9. Cell. 2015. PMID: 26165942 Free PMC article.
References
-
- Atkinson MR, Savageau MA, Myers JT, Ninfa AJ. Development of genetic circuitry exhibiting toggle switch or oscillatory behavior in Escherichia coli. Cell. 2003;113:597–607. - PubMed
-
- Balaban NQ, Merrin J, Chait R, Kowalik L, Leibler S. Bacterial persistence as a phenotypic switch. Science. 2004;305:1622–1625. - PubMed
Publication types
MeSH terms
Grants and funding
LinkOut - more resources
Full Text Sources
Other Literature Sources
