. 2009 Dec 24;139(7):1290-302.
doi: 10.1016/j.cell.2009.12.002.

Jarid2/Jumonji coordinates control of PRC2 enzymatic activity and target gene occupancy in pluripotent cells

Affiliations

Jarid2/Jumonji coordinates control of PRC2 enzymatic activity and target gene occupancy in pluripotent cells

Jamy C Peng et al. Cell. .

Abstract

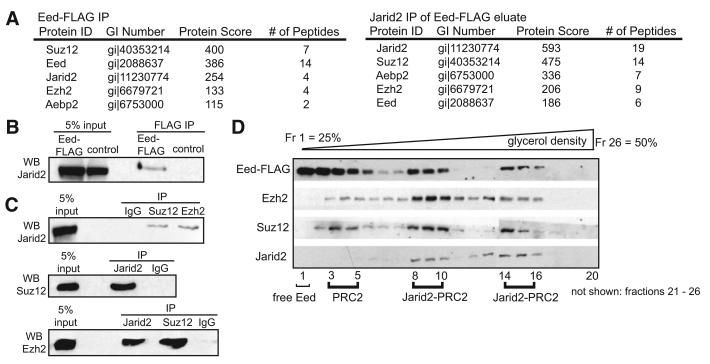
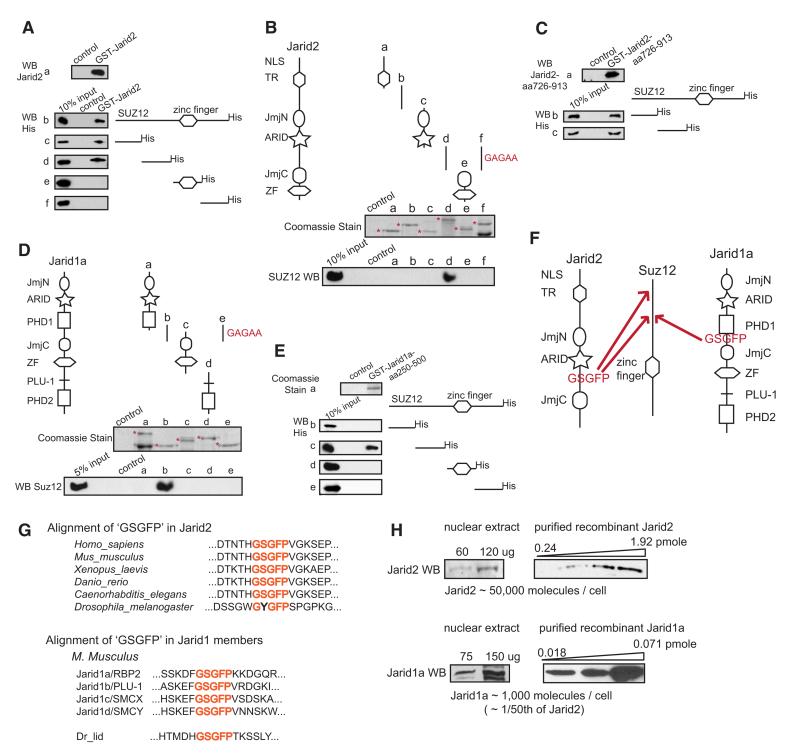
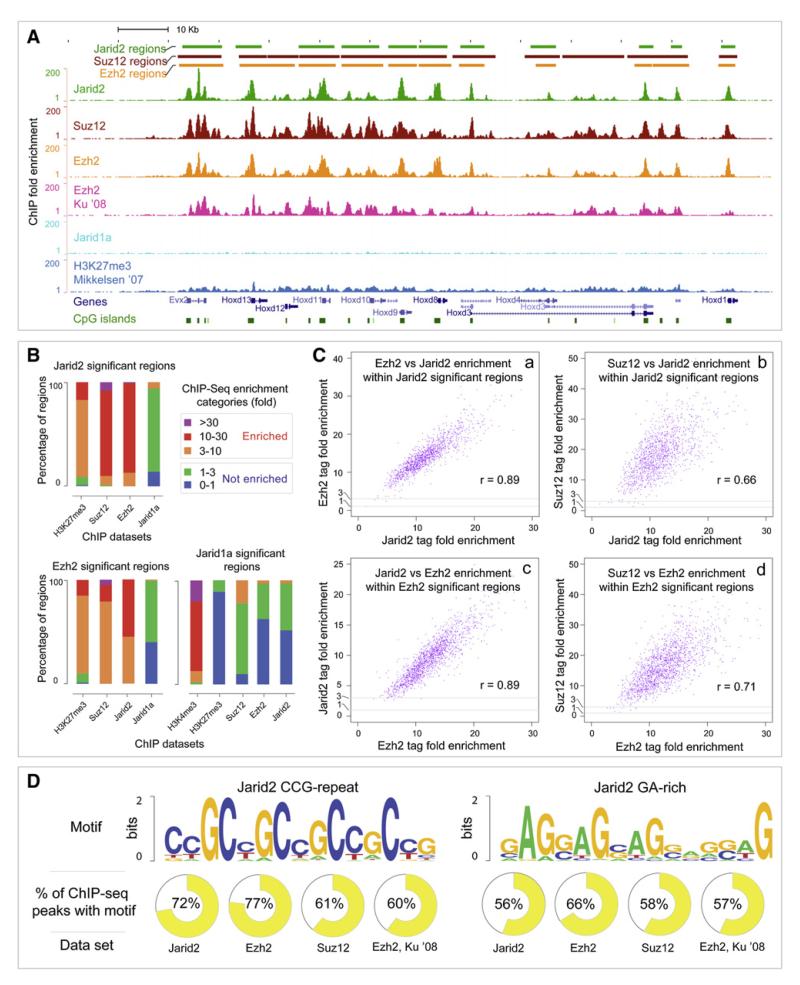
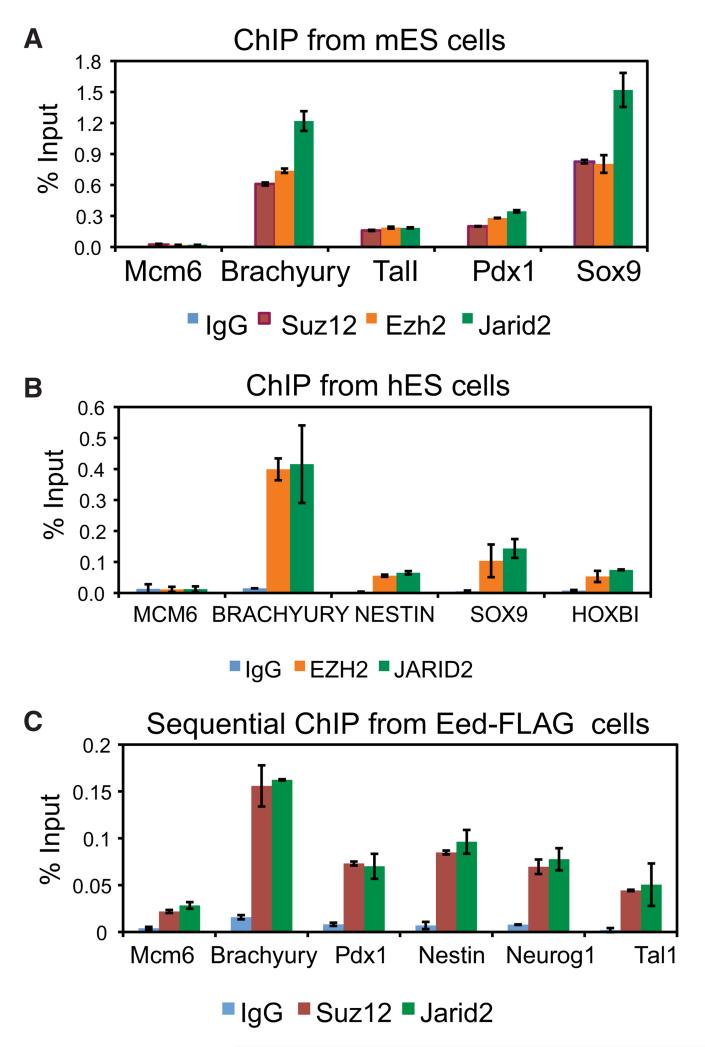
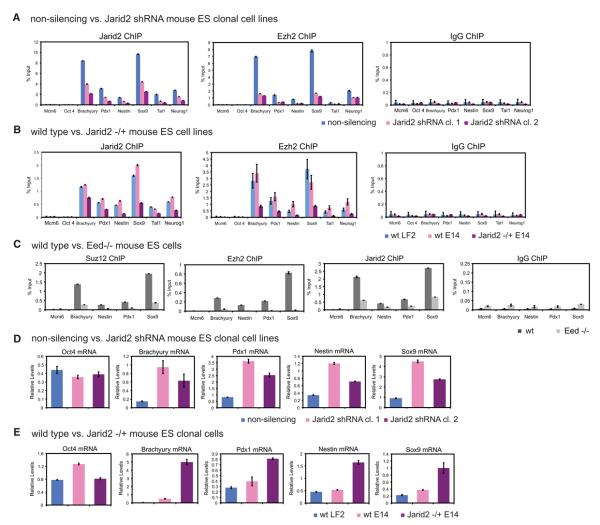
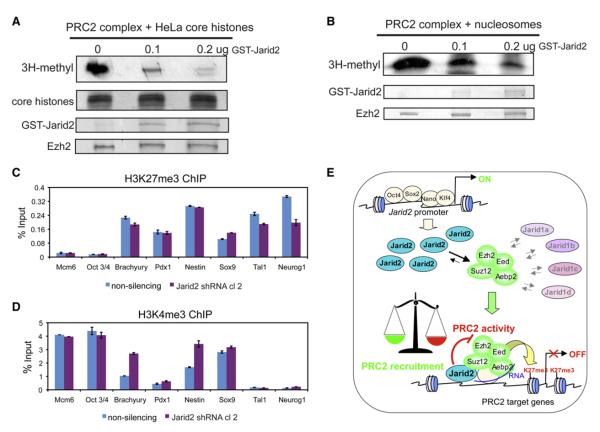
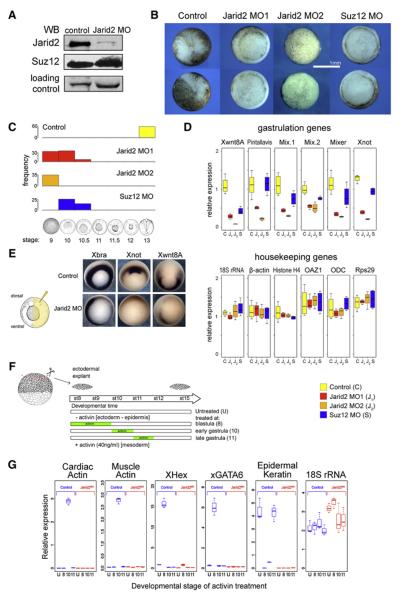
Polycomb Repressive Complex 2 (PRC2) regulates key developmental genes in embryonic stem (ES) cells and during development. Here we show that Jarid2/Jumonji, a protein enriched in pluripotent cells and a founding member of the Jumonji C (JmjC) domain protein family, is a PRC2 subunit in ES cells. Genome-wide ChIP-seq analyses of Jarid2, Ezh2, and Suz12 binding reveal that Jarid2 and PRC2 occupy the same genomic regions. We further show that Jarid2 promotes PRC2 recruitment to the target genes while inhibiting PRC2 histone methyltransferase activity, suggesting that it acts as a "molecular rheostat" that finely calibrates PRC2 functions at developmental genes. Using Xenopus laevis as a model we demonstrate that Jarid2 knockdown impairs the induction of gastrulation genes in blastula embryos and results in failure of differentiation. Our findings illuminate a mechanism of histone methylation regulation in pluripotent cells and during early cell-fate transitions.


Figures

Figure 1
Figure 1. Isolation of the PRC2 Complex from ES Cells Identified Jarid2 as a Novel Component
(A) Jarid2 associates with PRC2 in mouse ES cells. Left panel: proteins specifically identified in Eed-FLAG purification. Right panel: proteins specifically identified in Eed-FLAG/Jarid2 double purification. Protein identification scores (Mascot) and numbers of tryptic peptides identified are shown. See Figure S1 for purification schematics. (B) Confirmation of Jarid2-Eed association. FLAG immunoprecipitates from wt and Eed-FLAG ES cells were analyzed by anti-Jarid2 immunoblotting. (C) Association between endogenous Jarid2 and PRC2. Endogenous Suz12, Ezh2, and Jarid2 proteins were immunoprecipitated from ES cell nuclear extracts and analyzed by immunoblotting with indicated antibodies. (D) Jarid2 cosediments with PRC2. Eed-FLAG eluates were separated on a 25%–50% glycerol density gradient and fractions analyzed by immunoblotting with indicated antibodies.
Figure 2
Figure 2. Jarid2 and Jarid1a Directly Bind Suz12 via a Conserved Amino Acid Motif
(A) Recombinant Jarid2 associates with two N-terminal regions of Suz12. Full-length recombinant GST-Jarid2 protein (a) was used as a bait to pull full-length Suz12-His (b), or Suz12-His protein fragments (c–f). Bound proteins were visualized by anti-His immunoblotting. In all experiments, ‘control’ represents glutathione beads incubated with bacterial extracts not expressing bait proteins. (B) Jarid2 region corresponding to aa 726–913 binds Suz12 in a “GSGFP” motif dependent manner. Recombinant GST-Jarid2 protein fragments were used to pull recombinant full-length Suz12. Purified GST-fusion proteins were visualized by Coomasie staining (a-e, top panel, respective fusion proteins are marked with asterisks), and Suz12 binding was assayed by anti-Suz12 immunoblotting (a–e, bottom panel). The “GSGFP” motif embedded in the fragment d (aa 726–913 of mouse Jarid2), was substituted with ‘GAGAA’ sequence, and the mutated GST-fusion protein assayed for Suz12 binding (f). (C) aa 726-913 fragment of Jarid2 is sufficient for binding to both N-terminal regions of Suz12. GST-Jarid2 aa 726-913 fusion protein (a) was used as a bait to pull two N-terminal Suz12 fragments (aa 1-185 and aa 185-370 of mouse Suz12). Bound proteins were visualized by anti-His immunoblotting (b and c). (D) Jarid1a region corresponding to aa 250-500 binds Suz12 in a “GSGFP” motif dependent manner. Recombinant GST-Jarid1a protein fragments were used to pull full-length Suz12. Purified GST-fusion proteins were visualized by Coomasie staining (a–d, top panel, respective fusion proteins are marked with asterisks), and Suz12 binding was assayed by anti-Suz12 immunoblotting (a–d, bottom panel). The GSGFP motif embedded in fragment b (aa 250–500 of mouse Jarid1a), was substituted with GAGAA sequence, and the mutated GST-fusion protein assayed for Suz12 binding (e). (E) aa 250-500 fragment of Jarid1a binds a single Suz12 N-terminal region, corresponding to aa 185-370. GST-Jarid1a (shown in a) was used to pull Suz12-His fragments (b-e); bound proteins were visualized by anti-His immunoblotting. (F) Schematic diagram summarizing binding results presented in (A)–(E). (G) Conservation of the ‘GSGFP’ motif among Jarid proteins. Top panel: a sequence alignment of the “GSGFP”-containing regions in Jarid2 proteins from indicated species. Bottom panel: a sequence alignment of the “GSGFP”-containing regions in the four M. musculus Jarid1 family members, and in D. melanogaster Jarid1 homolog, Lid. Motif is highlighted in red. (H) Jarid2 and Jarid1a protein levels in mouse ES cells. Immunoblot signals of endogenous Jarid2 or Jarid1a from a defined amount of ES nuclear extract were compared to those of a serial dilution of purified, recombinant Jarid2 or Jarid1a protein fragments of a known concentration. Left and right panels represent same exposure of the same blot. Estimated number of molecules per cell nucleus is shown at the bottom. Calculations can be found in Supplemental Experimental Procedures.
Figure 3
Figure 3. Jarid2 and PRC2 Occupy Same Genomic Targets in ES Cells
(A) Genome browser representation of Jarid2, Suz12, Ezh2, Jarid1a and H3K27me3 binding patterns at the Hoxd gene cluster in mouse ES cells. The top three tracks represent calls for significantly enriched regions of Jarid2, Suz12 and Ezh2 ChIP-seq experiments as determined by QuEST software (Valouev et al., 2008). Following are six tracks displaying calculated ChIP-Seq enrichment values across the locus for Jarid2, Suz12, Ezh2 from this study, Ezh2 (Ku et al., 2008), Jarid1a from this study, and H3K27me3 (Mikkelsen et al., 2007) ChIP-seq datasets. Relative positions of genes and CpG islands are shown at the bottom. (B) Comparisons of coenrichment between ChIP-seq experiments. The three bar graphs represent relative levels of enrichment (defined as the fold enrichment of sequence tags relative to control across the entire region) of Suz12, Ezh2, Jarid2, Jarid1a, H3K27me3 and H3K4me3, as indicated, within Jarid2, Ezh2 and Jarid1a significant regions determined by QuEST. Three enriched categories correspond to ChIP-to-control tag enrichment ranges of 3-10 (orange), 10-30 (red) and over 30 (purple). Non-enriched categories correspond to relative tag enrichment levels of 0-1 (blue) and 1-3 (green). (C) Genome-wide analysis of Jarid2, Ezh2, and Suz12 co-occupancy. Scatter plots display mutual enrichment between indicated ChIP-Seq datasets relative to the input. Correlation values are shown. (D) Sequence motifs enriched in Jarid2-PRC2 bound regions. Logos (Crooks et al., 2004) for the two significant motifs identified using MEME software (from 200 bp windows around Jarid2 peaks) are shown. % of ChIP-seq regions containing the motif at 5% FDR is shown.
Figure 4
Figure 4. Jarid2 and PRC2 Simultaneously Bind Target Genes
(A) ChIP-qPCR analyses of Jarid2, Ezh2 and Suz12 binding at selected target genes in mouse ES cells. (B) ChIP-qPCR analyses of JARID2, EZH2 and SUZ12 binding at selected target genes in human ES cells. (C) Sequential ChIP of Suz12 and Jarid2 from Eed-FLAG-bound chromatin. y axis shows percent of input recovery. Error bars represent standard deviation calculated from triplicate qPCR reactions. Findings were confirmed by multiple biological replicates.
Figure 5
Figure 5. Jarid2 Controls PRC2 Target Occupancy in ES Cells
(A) Knockdown of Jarid2 results in diminished Ezh2 target binding. ChIP-qPCR analyses of Jarid2 and Ezh2 occupancy at selected target genes in clonal mouse ES cell lines expressing shRNA targeting Jarid2 (Jarid2 shRNA cl.1 and 2) versus non-silencing shRNA. y axis shows percent of input recovery. (B) Ezh2 association with gene targets is decreased in Jarid2 −/+ ES cells. ChIP-qPCR analyses are of wt LF2, wt E14, and E14 Jarid2 −/+ mouse ES cell lines. (C) Jarid2 and PRC2 target occupancy is mutually dependent. ChIP-qPCR analyses of Suz12, Ezh2 and Jarid2 occupancy at selected target genes in wt and Eed −/− mouse ES cells. (D) Jarid2 regulates expression of PRC2 target genes. RT-qPCR analysis of mRNA levels in Jarid2 shRNA cl.1 and 2 and non-silencing shRNA mouse ES cell lines. Expression was normalized to Pdha1 mRNA levels. (E) Expression of PRC2 targets is upregulated in Jarid2 −/+ ES cells. RT-qPCR analysis of mRNA levels (normalized to Pdha1), in wt LF2, wt E14, and E14 Jarid2 −/+ mouse ES cell lines. Error bars represent standard deviation calculated from triplicate qPCR reactions.
Figure 6
Figure 6. Jarid2 Directly Inhibits PRC2 Histone Methyltransferase Activity
(A) Jarid2 inhibits PRC2 HMT activity on core histones. Purified reconstituted PRC2 complex was pre-bound to 0, 0.1, and 0.2 ug of purified recombinant Jarid2 and used in HMT assays with native HeLa core histones as substrates and tritium-labeled S-adenosyl-methionine (3H-SAM) as a cofactor. 3H-methyl incorporation was visualized by fluorography (top panel). Histones, Jarid2 and Ezh2 present in each reaction were visualized by Coomasie staining, allowing for direct comparisons of the relative protein levels (bottom panels). (B) Jarid2 inhibits PRC2 HMT activity on nucleosomes. Reactions were performed as in (A) except that in vitro assembled recombinant nucleosomal templates were used as substrates. (C) H3K27me3 levels at selected PRC2 target genes are not significantly affected by Jarid2 knockdown. ChIP-qPCR analysis of H3K27me3 levels in mouse ES line expressing Jarid2 shRNA (Jarid2 shRNA cl. 2) versus non-silencing shRNA. We verified that histone recognition by H3K27me3 antibody is PRC2 dependent (Figure S8E). (D) H3K4me3 levels at selected PRC2 target genes in Jarid2 shRNA ES cells. ChIP-qPCR analysis of H3K4me3 levels in clonal mouse ES line expressing Jarid2 shRNA (Jarid2 shRNA cl. 2) versus non-silencing shRNA. (E) Model of Jarid2 in modulation of PRC2 recruitment and enzymatic activity. In ES cells, Jarid2 gene is under control of ES regulatory circuitry, resulting in high levels of Jarid2 expression and preferential formation of Jarid2-PRC2 complexes. Jarid2 simultaneously promotes the recruitment and inhibits the enzymatic activity of PRC2 (indicated as a balance). PRC2 targeting is mediated via a combinatorial mechanism involving Jarid2, other proteins and non-coding RNAs.
Figure 7
Figure 7. Jarid2 Is Required for Induction of Gastrulation Programs in Xenopus Embryos
(A) Knockdown of Jarid2 protein in Xenopus embryos. Immunoblotting analysis of nuclear extracts from gastrula stage embryos derived from control or Jarid2 MO1-injected two-cell stage embryos. (B) Downregulation of Jarid2 or Suz12 results in gastrulation arrest. Representative images of control, Jarid2 MO1-, Jarid2 MO2-, and Suz12 MO- treated embryos developed from the same batch of zygotes. Control embryos completed gastrulation and proceeded to neuru-late (imaged at stage 13), whereas Jarid2 MO1, Jarid2 MO2, and Suz12 MO embryos arrested at the late blastula stage or during early gastrulation (stages 9-10.5). (C) Penetrance of gastrulation defects shown in (B). (D) Impaired induction of gastrulation genes in Jarid2 MO1, Jarid2 MO2, and Suz12 MO embryos. RT-qPCR analyses of mRNA levels in control (C), Jarid2 MO1-treated (J1), Jarid2 MO2-treated (J2) and Suz12 MO-treated (S) late blastula stage embryos. mRNA levels of selected gastrulation genes (top panel) and housekeeping genes (bottom panel) are shown. (E) Jarid2 knockdown perturbs germ layer formation. Whole mount in situ detection of Xbra, Xnot, and Wnt8A transcripts in gastrula stage embryos derived from control or embryos asymmetrically injected with Jarid2 MO1 into one blastomere at the two-cell stage. (F) Schematic diagram of ectodermal explant assay. Ectodermal explants were isolated from the animal poles of early blastula embyos (stage 7) and cultured in the absence (“U”) or in presence of Activin A during: blastula stages 8 and 9 (“8”), early gastrulation between stages 10 and 11 (“10”), or late gastrulation between stages 11 and 12 (“11”). At developmental stage 15, explants were harvested for quantitative RT-qPCR assay. (G) Impaired mesoderm induction in response to Activin in Jarid2 MO explants. Results of RT-qPCR gene expression analysis of indicated genes relative to the whole sibling embryo at the same stage. Blue and red boxes indicate control and Jarid2 MO treated explants, respectively. In panels D and G the central line of the box and whisker plot represent median value, the hinges approximate quartiles and the whiskers extremal values (minimum and maximum).

Similar articles

Cited by

References

    1. Akkers RC, van Heeringen SJ, Jacobi UG, Janssen-Megens EM, Francoijs KJ, Stunnenberg HG, Veenstra GJ. A hierarchy of H3K4me3 and H3K27me3 acquisition in spatial gene regulation in Xenopus embryos. Dev. Cell. 2009;17:425–434. - PMC - PubMed
    1. Assou S, Cerecedo D, Tondeur S, Pantesco V, Hovatta O, Klein B, Hamamah S, De Vos J. A gene expression signature shared by human mature oocytes and embryonic stem cells. BMC Genomics. 2009;10:10. - PMC - PubMed
    1. Barski A, Cuddapah S, Cui K, Roh TY, Schones DE, Wang Z, Wei G, Chepelev I, Zhao K. High-resolution profiling of histone methylations in the human genome. Cell. 2007;129:823–837. - PubMed
    1. Beissbarth T, Speed TP. GOstat: find statistically overrepresented Gene Ontologies within a group of genes. Bioinformatics. 2004;20:1464–1465. - PubMed
    1. Blythe SA, Reid CD, Kessler DS, Klein PS. Chromatin immunoprecipitation in early Xenopus laevis embryos. Dev. Dyn. 2009;238:1422–1432. - PMC - PubMed

Publication types