. 2010 Jan;6(1):e1000719.
doi: 10.1371/journal.ppat.1000719. Epub 2010 Jan 8.

Temporal proteome and lipidome profiles reveal hepatitis C virus-associated reprogramming of hepatocellular metabolism and bioenergetics

Affiliations

Temporal proteome and lipidome profiles reveal hepatitis C virus-associated reprogramming of hepatocellular metabolism and bioenergetics

Deborah L Diamond et al. PLoS Pathog. 2010 Jan.

Abstract

Proteomic and lipidomic profiling was performed over a time course of acute hepatitis C virus (HCV) infection in cultured Huh-7.5 cells to gain new insights into the intracellular processes influenced by this virus. Our proteomic data suggest that HCV induces early perturbations in glycolysis, the pentose phosphate pathway, and the citric acid cycle, which favor host biosynthetic activities supporting viral replication and propagation. This is followed by a compensatory shift in metabolism aimed at maintaining energy homeostasis and cell viability during elevated viral replication and increasing cellular stress. Complementary lipidomic analyses identified numerous temporal perturbations in select lipid species (e.g. phospholipids and sphingomyelins) predicted to play important roles in viral replication and downstream assembly and secretion events. The elevation of lipotoxic ceramide species suggests a potential link between HCV-associated biochemical alterations and the direct cytopathic effect observed in this in vitro system. Using innovative computational modeling approaches, we further identified mitochondrial fatty acid oxidation enzymes, which are comparably regulated during in vitro infection and in patients with histological evidence of fibrosis, as possible targets through which HCV regulates temporal alterations in cellular metabolic homeostasis.


Conflict of interest statement

The authors have declared that no competing interests exist.

Figures

Figure 1
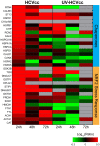
Figure 1. HCV infection induces temporal changes in the host cell proteome.
Data from the five strong cation exchange (SCX) fractions generated and analyzed for each sample were processed and loaded into Rosetta Elucidator (Rosetta Biosoftware Inc.) for error modeling and computation of final protein abundance ratios. Among 2,418 unique proteins quantified, a total of 495 proteins differentially regulated (≥1.5-fold change, p-value≤0.05) in at least two experiments were selected for subsequent cluster analysis. Two-dimensional hierarchical clustering was performed with a weighted average method and Cosine correlation metric. Each horizontal row represents an individual infection condition and each vertical column an individual protein (495 total). Abundance ratios were monitored 24, 48 and 72 h after infection with either HCVcc (chimeric HCV 2a virus, J6/JFH-1) or UV-HCVcc (UV-inactivated chimeric HCV 2a virus, J6/JFH-1) and using a time-matched mock (conditioned media, CM) as the reference. Protein abundance ratios are colored according to the fold changes and the color scale indicates the magnitude of fold change. Black squares indicate no change in protein abundance. Gray squares indicate missing data.
Figure 2
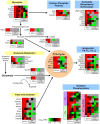
Figure 2. HCV induces perturbations in metabolic homeostasis.
The 495 differentially regulated proteins described in Figure 1 were subjected to functional and canonical pathway analysis using Ingenuity Pathways Analysis (Ingenuity Systems Inc). Shown here is a metabolic map illustrating the dynamic changes in host biosynthetic and catabolic pathways occurring during HCV infection. Each horizontal row represents a differentially regulated protein identified by its gene symbol and each vertical column represents an individual infection condition. Abundance ratios for the various samples appear in the following order from left to right: infection with HCVcc at 24, 48 and 72 h (columns 1, 2, and 3, respectively) or UV-HCVcc at 24, 48 and 72 h (columns 4, 5, and 6, respectively). Protein abundance ratios are colored according to the fold changes and the color scale indicates the magnitude of fold change. Black squares indicate no change in protein abundance. Gray squares indicate missing data. HCV infection induces a unique proteomic profile indicative of marked disruptions in cellular metabolic homeostasis. The limited overlap, and in some cases magnitude, of protein up-regulation in actively growing cells exposed to UV-inactivated virus further suggests that infectious HCVcc specifically institutes its own metabolic program by considerably stimulating host biosynthetic activities supporting viral growth. See text and Supplementary Table S2 for more detail including correlation of gene symbol with protein name.
Figure 3
Figure 3. HCV induces protein abundance changes indicative of endoplasmic reticulum (ER) stress and oxidative stress during acute infection of cultured Huh-7.5 cells.
Each horizontal row represents a differentially regulated protein identified by its gene symbol and each vertical column represents an individual HCV infection time point. Abundance ratios for the various samples appear in the following order from left to right: infection with HCVcc at 24, 48 and 72 h (columns 1, 2, and 3, respectively) or UV-HCVcc at 24, 48 and 72 h (columns 4, 5, and 6, respectively). Protein abundance ratios are colored according to the fold changes and the color scale indicates the magnitude of fold change. Black squares indicate no change in protein abundance. Gray squares indicate missing data. Refer to Supplementary Table S2 for more detail including correlation of gene symbol with protein name.
Figure 4
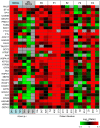
Figure 4. Common regulation of protein abundance changes in HCV-infected Huh-7.5 cells and patient liver tissue.
Each horizontal row represents a differentially regulated protein identified by its gene symbol. Each vertical column represents an individual sample. Abundance ratios for the various samples appear in the following order from left to right: cultured hepatoma cells infected with HCVcc at 24, 48 and 72 h, cultured hepatoma cells exposed to UV-HCVcc at 24, 48 and 72 h, and then patients chronically infected with HCV and exhibiting stage 0 (F0), stage 1 (F1), stage 2 (F2), stage 3 (F3) or stage 4 (F4) fibrosis . Protein abundance ratios are colored according to the fold changes and the color scale indicates the magnitude of fold change. Black squares indicate no change in protein abundance. Gray squares indicate missing data. Protein abundance information for HCVcc-infected Huh-7.5 cells can be found in Supplementary Table S2 and for human liver biopsy specimens in .
Figure 5
Figure 5. Principal components analysis scores plot showing the segregation of samples based on lipid profiles.
Duplicate lipid abundance measurements (corresponding to R1 and R2) were made 24, 48 and 72 h after infection with either HCVcc or UV-HCVcc and using a time-matched mock (conditioned media, CM) as the reference. A total of 272 features significantly different (ANOVA, p<0.05) between treatment and time were compared using principal components analysis (PCA). The scores plot shows temporal differences (represented along principal component 1) as well as HCV-specific differences (represented along principal component 2).
Figure 6
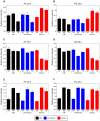
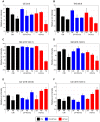
Figure 6. Representative examples of phospholipid species differentially regulated during HCV infection.
The relative ion intensity, log 2 scale, and standard deviation is plotted for various phosphatidylcholine (PC) and phosphatidylethanolamine (PE) species monitored 24, 48 and 72 h after infection with either HCVcc (red bars) or UV-HCVcc (blue bars) and using a time-matched mock (conditioned media, CM; black bars) as the reference. Panels A-D (lipid species PC 30∶0, PE 35∶0, PC 35∶1, and PE 38∶3, respectively) provide examples of phospholipid species exhibiting notable changes in abundance during the course of HCV infection. Temporal lipid abundance changes conserved across treatment conditions, panels E and F (lipid species PC 32∶2 and PC 34∶3, respectively), demonstrate the specificity of those perturbations attributed to HCV infection. See Supplementary Table S3 for a complete listing of the lipid features detected in this study.
Figure 7
Figure 7. Representative examples of additional major lipid classes differentially regulated during HCV infection.
The relative ion intensity, log 2 scale, and standard deviation is plotted for various other lipid classes monitored 24, 48 and 72 h after infection with either HCVcc (red bars) or UV-HCVcc (blue bars) and using a time-matched mock (conditioned media, CM; black bars) as the reference. Panels A-D provide examples of HCV-associated decreases in the relative abundance of cholesterol ester (CE 20∶5), triacylglycerol (TAG 56∶8), and sphingomyelin (SM (d16∶1/24∶1) and SM (d18∶1/24∶1)) species, respectively. This contrasts with the HCV-associated increase in relative abundance of lipotoxic ceramide (CER) species shown in panels E and F (Cer (d18∶1/24∶0) and Cer (d18∶1/24∶1)), respectively. See legend of Figure 5 for details on the experiment representation and Supplementary Table S3 for a complete listing of the lipid features detected in this study.
Figure 8
Figure 8. Production of infectious HCV in cell culture.
Limiting dilution assays were performed to quantify the amount of infectious HCVcc particles in the cell culture supernatant, measured as 50% tissue culture infectious dose per milliliter (TCID50/ml). HCV infectivity accumulated until 72 h, after which a decline occurred that parallels the previously described decrease in HCV RNA levels . The reason for these decreases is unclear, but may be related to a decrease in the number of cells capable of producing high levels of virus.
Figure 9
Figure 9. Integration of different network types improves identification of important nodes in HCV infection.
Topology of the networks was calculated to identify topological bottlenecks, which were then evaluated for statistical enrichment in proteins known to be targets of HCV proteins by IMAP . The number of identified targets (X axis) is shown against the overall fold enrichment of targets in bottlenecks relative to the rest of the network. The results show that integrating different networks improves the ability to detect these important proteins, and implies that bottlenecks not known to be direct targets of HCV might be playing important roles in the host response process. The networks are: PPI, human protein-protein interactions limited to those between proteins identified by proteomics; Proteomics, correlation-based network from proteomics abundance data; Proteomics-PPI, combined network of proteomics and PPI networks; Proteomics-Lip, combined network of proteomics and lipidomics; Prot-PPI-Lip, combined network of proteomics, PPI and lipidomics.
Figure 10
Figure 10. The integrated network surrounding several key bottlenecks identified by computational modeling efforts.
The neighbors of bottlenecks in the integrated network (DCI, HADHB, PC 30∶0, PE 38∶3, and PE 38∶6) are shown. Relationships between the proteins and lipid species are grey for proteomics correlation, purple for lipidomics-proteomics correlation, black for protein-protein interactions and red for IMAP relationships. Lipid species are indicated as green diamonds, HCV proteins are red, mitochondrial proteins are squares, and proteins involved in fatty acid β-oxidation are in black.

Similar articles

Cited by

References

    1. Alter MJ, Margolis HS, Krawczynski K, Judson FN, Mares A, et al. The natural history of community-acquired hepatitis C in the United States. The Sentinel Counties Chronic non-A, non-B Hepatitis Study Team. N Engl J Med. 1992;327:1899–1905. - PubMed
    1. Ikeda M, Kato N. Modulation of host metabolism as a target of new antivirals. Adv Drug Deliv Rev. 2007;59:1277–1289. - PMC - PubMed
    1. He Y, Duan W, Tan SL. Emerging host cell targets for hepatitis C therapy. Drug Discov Today. 2007;12:209–217. - PubMed
    1. Ye J. Reliance of host cholesterol metabolic pathways for the life cycle of hepatitis C virus. PLoS Pathog. 2007;3:e108. doi: 10.1371/journal.ppat.0030108. - DOI - PMC - PubMed
    1. Negro F, Sanyal AJ. Hepatitis C virus, steatosis and lipid abnormalities: clinical and pathogenic data. Liver Int. 2009;S2:26–37. - PubMed

Publication types

LinkOut - more resources