. 2010 Mar 12;396(5):1346-60.
doi: 10.1016/j.jmb.2009.12.059. Epub 2010 Jan 11.

A folding zone in the ribosomal exit tunnel for Kv1.3 helix formation

Affiliations

A folding zone in the ribosomal exit tunnel for Kv1.3 helix formation

Li Wei Tu et al. J Mol Biol. .

Abstract

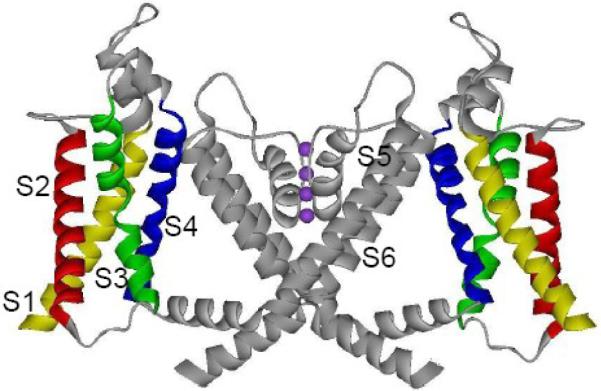
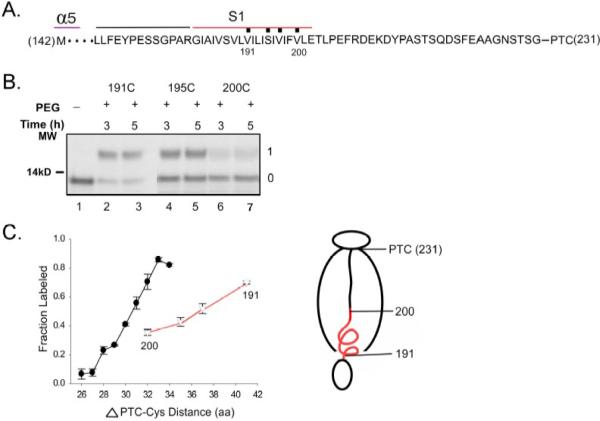
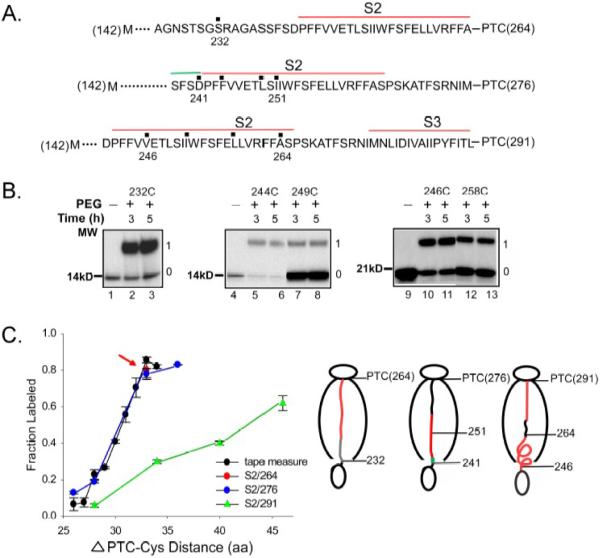
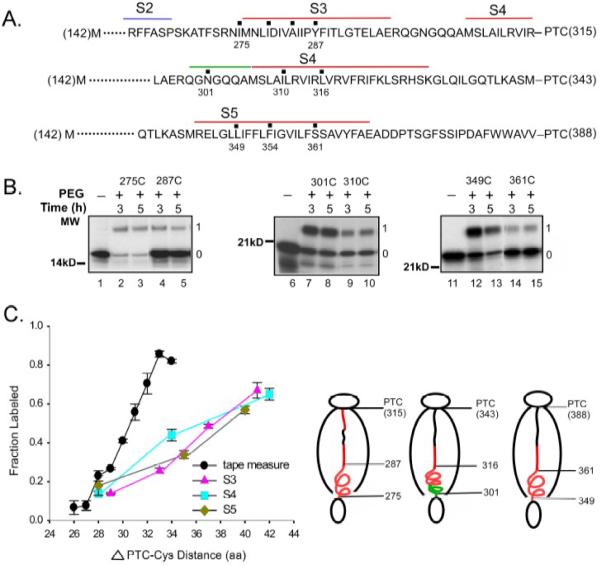
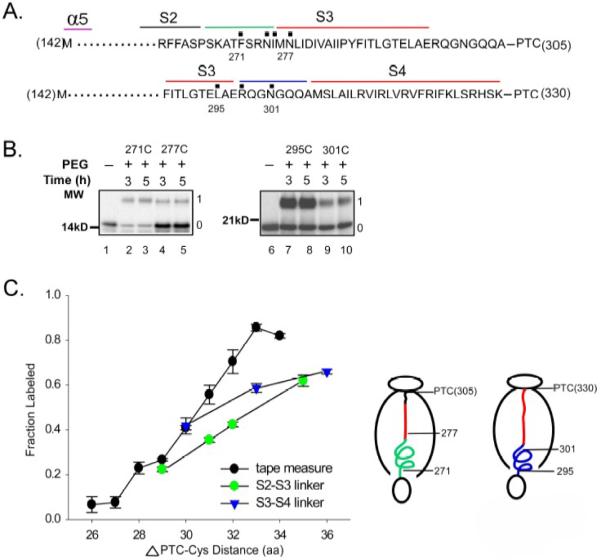
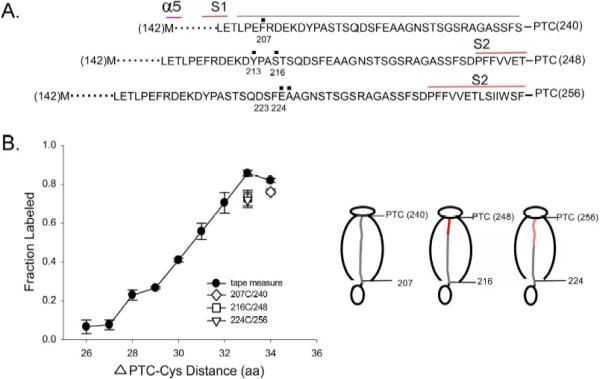
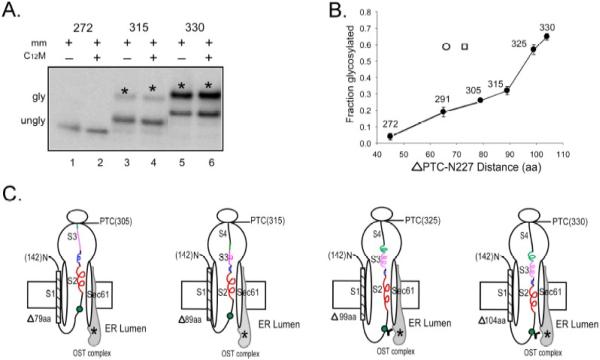
Although it is now clear that protein secondary structure can be acquired early, while the nascent peptide resides within the ribosomal exit tunnel, the principles governing folding of native polytopic proteins have not yet been elucidated. We now report an extensive investigation of native Kv1.3, a voltage-gated K(+) channel, including transmembrane and linker segments synthesized in sequence. These native segments form helices vectorially (N- to C-terminus) only in a permissive vestibule located in the last 20 A of the tunnel. Native linker sequences similarly fold in this vestibule. Finally, secondary structure acquired in the ribosome is retained in the translocon. These findings emerge from accessibility studies of a diversity of native transmembrane and linker sequences and may therefore be applicable to protein biogenesis in general.


Figures

Figure 1
Figure 1. Structure of Kv1.2/Kv2.1 chimera
A ribbon representation of two opposing subunits of Kv1.2/Kv2.1 was made in DS ViewerPro (www.accelrys.com) from Long et al.. Four K+ ions in the selectivity filter are shown as purple spheres. The transmembrane segments, S1, S2, S3, S4 are shown as yellow, red, green, and blue ribbons, respectively, and S5, S6 and the pore helix are depicted as gray ribbons.
Figure 2
Figure 2. C-terminal segment of S1 in the tunnel
(A) The primary sequence of S1 and flanking sequences. The amino acid sequence is indicated by a single-letter code. Long stretches of amino acids present in the construct but omitted from the diagrammed sequence are indicated by ellipses (….). The filled squares above selected amino acids represent residues mutated, one at a time, to cysteine. A restriction enzyme was used to truncate the peptide at residue 231, which remains attached to tRNA at the PTC. The start site of all T1-deleted Kv1.3 constructs is 142. The number under the letter code corresponds to the amino acid in the native full-length sequence in Kv1.3 used to generate the indicated ΔPTC values. Different segments of Kv1.3 are labeled above the corresponding sequence. (B) Pegylation of S1 C-terminal region. Nascent peptides were pegylated and fractionated on polyacrylamide gels as described in the Methods. The first lane, derived from a sample not treated with PEG-MAL, was used as the zero time point. Lanes 2–7 for each indicated cysteine residue show samples incubated with 1mM PEG-MAL for 3 and 5h. Gels were 12% NuPAGE Bis-Tris gels with MES running buffer. The number to the left of the gel is a molecular weight standard; numbers to the right of the gel indicate unpegylated (0) and singly pegylated (1) protein. (C) Fraction of nascent peptide labeled. The x-axis is the number of amino acids from the PTC site to (and including) the labeled cysteine. Pegylation of a known extended peptide, the tape measure is shown by the filled circles and represents data taken from Lu and Deutsch. The final extent of pegylation of individual residues in the C-terminus of S1 is represented by the open triangles. Data are means ± SEM (n ≥ 3). The cartoon next to the plot depicts the ribosome with the nascent peptide, indicating the PTC, and, in red, the segment scanned and pegylated. Secondary structure is indicated by the helical drawing of the red line. The N-terminal portion of the nascent peptide that resides outside of the tunnel is represented as a circle below the ribosome because its structure outside the tunnel is unknown.
Figure 3
Figure 3. The S2 transmembrane segment in the tunnel
(A) The primary sequences, as described for Figure 2A, are shown for the NheI (264)-cut construct, the BspHI (276)-cut construct, and the KpnI (291)-cut construct. (B) Pegylation of S2 residues. The gels are as described in Figure 2C. (C) Fraction of nascent peptide labeled. The final extent of pegylation of S2 residues in the (264)-cut construct is shown as the red circle (highlighted by arrow), the (276)-cut construct, as blue circles, and the (291)-cut construct, as green triangles. Data are means ± SEM for triplicate samples. Each cartoon, as described in figure legend 2C, depicts the cut-site at the PTC, the region scanned, and an interpretation of the data: the peptide region scanned is extended for the constructs cut at 264 and 276, but compact for the construct cut at residue 291.
Figure 4
Figure 4. Transmembrane segments S3, S4, and S5 in the tunnel
(A) The primary sequences of constructs for probing the secondary structure of S3 (NsiI (315)-cut construct), S4 (XcmI (343)-cut construct), and S5 (BstEII (388)-cut construct). (B). Fraction of peptide labeled. For each transmembrane segment, S3–S5, the tested cysteines are indicated by red, green, and tan symbols, respectively, and plotted along with the length-dependent pegylation for the tape measure (solid black circles). Data are means ± SEM for triplicate samples. The cartoon, as described in figure legend 2C, depicts the cut-site at the PTC, the region scanned, and an interpretation of the data: In each case, the peptide region scanned is compact (likely α-helical).
Figure 5
Figure 5. The S2–S3 and S3–S4 linkers in the tunnel
(A) The primary sequences are shown for the BstXI (305)-cut construct and the StyI (330)-cut construct. (B). Fraction of peptide labeled for the S2–S3 (green circles) and S3–S4 (blue triangles) linkers. The length-dependent pegylation for the tape measure is shown as filled black circles. Data are means ± SEM for triplicate samples. In some cases, the SEM values are smaller than the symbol. The cartoons, as described in figure legend 2C, depict the cut-sites at the PTC (305 and 330, respectively), the region scanned (271–277 and 295–310, respectively), and interpretations of the data: The S2–S3 linker scanned is compact (likely α-helical), as is the S3–S4 linker region scanned
Figure 6
Figure 6. The S1–S2 linker in the tunnel
(A). The primary sequences of the S1–S2 linker located in three different tunnel locations. (B). Fraction of nascent peptide labeled. The final extent of pegylation of individual S1–S2 linker residues is represented by the open diamond (207C), square (216C), and inverted triangle (224C) in constructs with residues 240, 248, and 256, respectively, at the PTC. The all-extended tape measure is shown as black circles. Data are means ± SEM for triplicate samples. The cartoons, as described in figure legend 2C, depict peptides generated by different cut-sites at the PTC, the respective cysteines tested (range of ΔPTC is 33–34), and an interpretation of the data: The S1–S2 loop is extended in every location in the tunnel.
Figure 7
Figure 7. Helices inside the translocon
(A). Glycosylation of nascent peptide. Constructs of various lengths (ΔPTC-N227) were translated as described previously but in the presence of microsomal membranes (mm) and glycosylation of the nascent peptide asparagine residue, N227, was evaluated by gel fractionation using a 4–12% NuPAGE Bis-Tris gel for the constructs indicated. The numbers 272, 315, and 330 represent the residue that remains attached to the tRNA at the PTC. The lower band in each lane indicates unglycosylated peptide. The upper band (marked by an asterisk) in each lane indicates peptide glycosylated by the oligosaccharyltransferase complex in the ER lumen. (B). Extent of glycosylation. The fraction glycosylated was calculated from the C12M-treated samples (lanes 2, 4, 6) as the cpm in the upper band divided by the sum of cpm in the upper and lower bands, and plotted as a function of distance in amino acids from the PTC, ΔPTC-N227. According to von Heijne and co-workers, a peptide that is all extended in the ribosome-translocon complex achieves maximal glycosylation at a chain length of ~66 from the PTC to the asparagine (open circle), whereas a compact peptide control containing 17 leucines is maximally glycosylated at a chain length of ~74 from the PTC to the asparagine (open square). Data are means ± SEM for triplicate measurements. (C). Cartoon representations of the ribosome-translocon complex with different length peptides based on results from Figures 2–5 and 7B. Segments depicted are S2 (red line), S2–S3 linker (blue line), S3 (pink line), S3–S4 linker (green line) and S4 (black line). A helical versus extended conformation is suggested by the line shape. The green circle represents N227, which is glycosylated (Y-shaped black symbol) in the third and fourth cartoons (PTC 325 and 330). The OST complex (gray) includes the oligosaccharyltransferase enzyme that resides in the ER lumen and the asterisk indicates the active site of the enzyme. The translocon (elongated white ovals) is labeled as Sec61. Each different restriction site (305, 315, 325, 330) produces a different ΔPTC-N227 (labeled as Δ79, Δ89, Δ99, Δ104, respectively) and relocates S2, S3, and S4 in the ribosome-translocon complex as indicated, according to the assumptions/caveats stated in the text. The relative lengths of transmembrane and linker segments are not to scale.

Similar articles

Cited by

References

    1. Nissen P, Hansen J, Ban N, Moore PB, Steitz TA. The structural basis of ribosome activity in peptide bond synthesis. Science. 2000;289:920–930. - PubMed
    1. Kosolapov A, Tu L, Wang J, Deutsch C. Structure Acquisition of the T1 Domain of Kv1.3 During Biogenesis. Neuron. 2004;44:295–307. - PubMed
    1. Lu J, Deutsch C. Secondary structure formation of a transmembrane segment in Kv channels. Biochemistry. 2005;44:8230–8243. - PubMed
    1. Lu J, Deutsch C. Folding zones inside the ribosomal exit tunnel. Nat. Struct. Mol. Biol. 2005;12:1123–1129. - PubMed
    1. Woolhead CA, McCormick PJ, Johnson AE. Nascent membrane and secretory proteins differ in FRET-detected folding far inside the ribosome and in their exposure to ribosomal proteins. Cell. 2004;116:725–736. - PubMed

Publication types

MeSH terms

Substances

LinkOut - more resources