

Regulation of CCL2 and CCL3 expression in human brain endothelial cells by cytokines and lipopolysaccharide
- PMID: 20047691
- PMCID: PMC2819252
- DOI: 10.1186/1742-2094-7-1
Regulation of CCL2 and CCL3 expression in human brain endothelial cells by cytokines and lipopolysaccharide
Abstract
Background: Chemokines are emerging as important mediators of CNS inflammation capable of activating leukocyte integrins and directing the migration of leukocyte subsets to sites of antigenic challenge. In this study we investigated the expression, release and binding of CCL2 (MCP-1) and CCL3 (MIP-1alpha) in an in vitro model of the human blood-brain barrier.
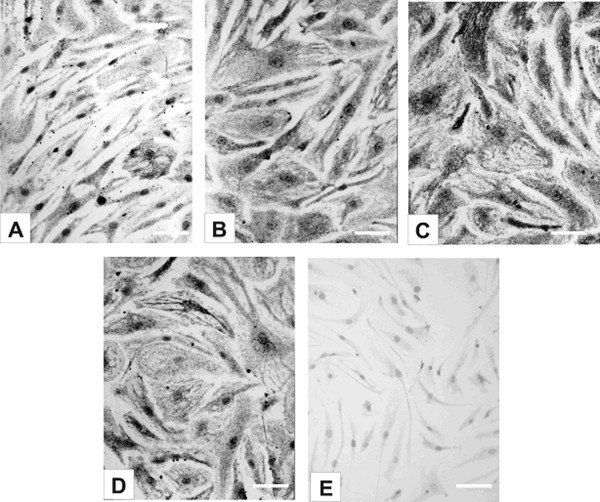
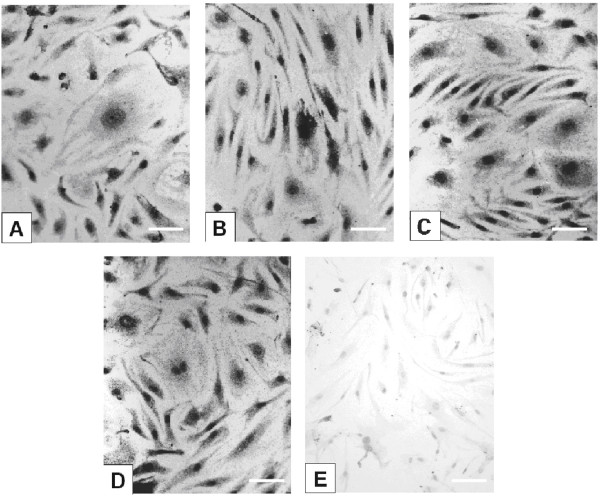
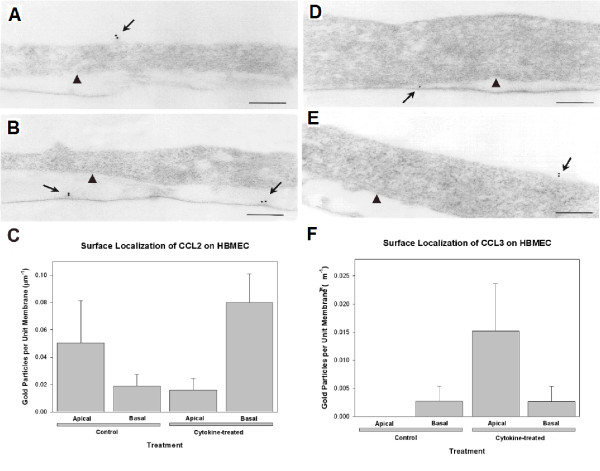
Methods: The kinetics of expression and cytokine upregulation and release of the beta-chemokines CCL2 and CCL3 were studied by immunocytochemistry and enzyme-linked immunosorbent assay in primary cultures of human brain microvessel endothelial cells (HBMEC). In addition, the differential binding of these chemokines to the basal and apical endothelial cell surfaces was assessed by immunoelectron microscopy.
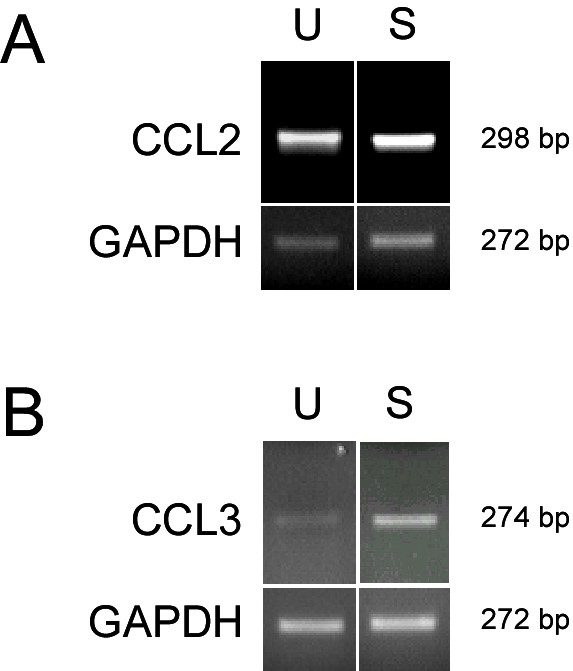
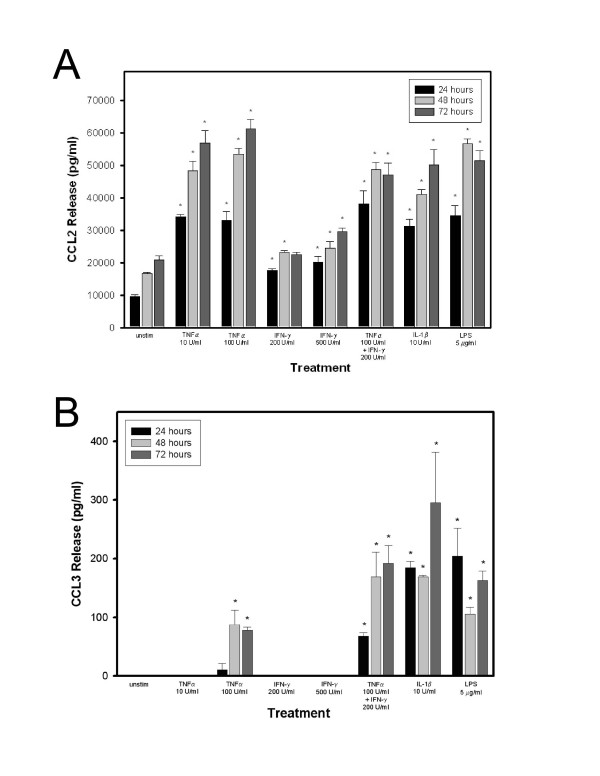
Results: Untreated HBMEC synthesize and release low levels of CCL2. CCL3 is minimally expressed, but not released by resting HBMEC. Treatment with TNF-alpha, IL-1beta, LPS and a combination of TNF-alpha and IFN-gamma, but not IFN-gamma alone, significantly upregulated the expression and release of both chemokines in a time-dependent manner. The released CCL2 and CCL3 bound to the apical and basal endothelial surfaces, respectively. This distribution was reversed in cytokine-activated HBMEC resulting in a predominantly basal localization of CCL2 and apical distribution of CCL3.
Conclusions: Since cerebral endothelial cells are the first resident CNS cells to contact circulating leukocytes, expression, release and presentation of CCL2 and CCL3 on cerebral endothelium suggests an important role for these chemokines in regulating the trafficking of inflammatory cells across the BBB in CNS inflammation.
Figures
Similar articles
-
Differential regulation of CD4+ T cell adhesion to cerebral microvascular endothelium by the β-chemokines CCL2 and CCL3.Int J Mol Sci. 2012 Nov 30;13(12):16119-40. doi: 10.3390/ijms131216119. Int J Mol Sci. 2012. PMID: 23203188 Free PMC article.
-
Regulation of beta-chemokine mRNA expression in adult rat astrocytes by lipopolysaccharide, proinflammatory and immunoregulatory cytokines.Scand J Immunol. 1998 Nov;48(5):502-8. doi: 10.1046/j.1365-3083.1998.00422.x. Scand J Immunol. 1998. PMID: 9822259
-
Expression of the beta-chemokines RANTES and MIP-1 beta by human brain microvessel endothelial cells in primary culture.J Neuropathol Exp Neurol. 2000 May;59(5):339-52. doi: 10.1093/jnen/59.5.339. J Neuropathol Exp Neurol. 2000. PMID: 10888363
-
C-C motif chemokine ligand (CCL) production in equine peripheral blood mononuclear cells identified by newly generated monoclonal antibodies.Vet Immunol Immunopathol. 2018 Oct;204:28-39. doi: 10.1016/j.vetimm.2018.09.003. Epub 2018 Sep 11. Vet Immunol Immunopathol. 2018. PMID: 30596378
-
Ellagic acid ameliorates cuprizone-induced acute CNS inflammation via restriction of microgliosis and down-regulation of CCL2 and CCL3 pro-inflammatory chemokines.Cell Mol Biol (Noisy-le-grand). 2016 Oct 31;62(12):24-30. doi: 10.14715/cmb/2016.62.12.5. Cell Mol Biol (Noisy-le-grand). 2016. PMID: 27894396
Cited by
-
CCR5 and Biological Complexity: The Need for Data Integration and Educational Materials to Address Genetic/Biological Reductionism at the Interface of Ethical, Legal, and Social Implications.Front Immunol. 2021 Dec 2;12:790041. doi: 10.3389/fimmu.2021.790041. eCollection 2021. Front Immunol. 2021. PMID: 34925370 Free PMC article.
-
Antibody-enhanced microdialysis collection of CCL2 from rat brain.J Neurosci Methods. 2011 Nov 15;202(2):124-7. doi: 10.1016/j.jneumeth.2011.05.006. Epub 2011 May 11. J Neurosci Methods. 2011. PMID: 21600925 Free PMC article.
-
Blocking PDGF-CC signaling ameliorates multiple sclerosis-like neuroinflammation by inhibiting disruption of the blood-brain barrier.Sci Rep. 2020 Dec 24;10(1):22383. doi: 10.1038/s41598-020-79598-z. Sci Rep. 2020. PMID: 33361796 Free PMC article.
-
Three-Dimensionally Cultured Jaw Periosteal Cells Attenuate Macrophage Activation of CD4+ T Cells and Inhibit Osteoclastogenesis.Int J Mol Sci. 2024 Feb 16;25(4):2355. doi: 10.3390/ijms25042355. Int J Mol Sci. 2024. PMID: 38397031 Free PMC article.
-
(-)-Epigallocatechin gallate inhibits endotoxin-induced expression of inflammatory cytokines in human cerebral microvascular endothelial cells.J Neuroinflammation. 2012 Jul 6;9:161. doi: 10.1186/1742-2094-9-161. J Neuroinflammation. 2012. PMID: 22768975 Free PMC article.
References
-
- Rapoport SI. In: Blood-brain barrier in physiology and medicine. Rapoport SI, editor. New York: Raven Press; 1976. Sites and functions of the blood-brain barrier; pp. 43–86.
-
- Pardridge WM. Introduction to the Blood-Brain Barrier: Methodology, Biology and Pathology. Cambridge University Press; 1998.
Publication types
MeSH terms
Substances
LinkOut - more resources
Full Text Sources
Miscellaneous
