A 3.5-nm structure of rat TRPV4 cation channel revealed by Zernike phase-contrast cryoelectron microscopy
- PMID: 20044482
- PMCID: PMC2856998
- DOI: 10.1074/jbc.M109.090712
A 3.5-nm structure of rat TRPV4 cation channel revealed by Zernike phase-contrast cryoelectron microscopy
Abstract
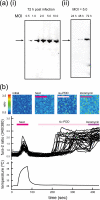
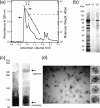
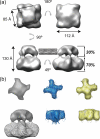
The transient receptor potential vanilloid 4 (TRPV4) is a non-selective cation channel responsive to various stimuli including cell swelling, warm temperatures (27-35 degrees C), and chemical compounds such as phorbol ester derivatives. Here we report the three-dimensional structure of full-length rat TRPV4 purified from baculovirus-infected Sf9 cells. Hexahistidine-tagged rat TRPV4 (His-rTRPV4) was solubilized with detergent and purified through affinity chromatography and size-exclusion chromatography. Chemical cross-linking analysis revealed that detergent-solubilized His-rTRPV4 was a tetramer. The 3.5-nm structure of rat TRPV4 was determined by cryoelectron microscopy using single-particle reconstruction from Zernike phase-contrast images. The overall structure comprises two distinct regions; a larger dense component, likely corresponding to the cytoplasmic N- and C-terminal regions, and a smaller component corresponding to the transmembrane region.
Figures


Similar articles
-
Structure of TRPV1 channel revealed by electron cryomicroscopy.Proc Natl Acad Sci U S A. 2008 May 27;105(21):7451-5. doi: 10.1073/pnas.0711835105. Epub 2008 May 19. Proc Natl Acad Sci U S A. 2008. PMID: 18490661 Free PMC article.
-
Structural insight into the assembly of TRPV channels.Structure. 2014 Feb 4;22(2):260-8. doi: 10.1016/j.str.2013.11.008. Epub 2013 Dec 26. Structure. 2014. PMID: 24373766 Free PMC article.
-
Determinants of 4 alpha-phorbol sensitivity in transmembrane domains 3 and 4 of the cation channel TRPV4.J Biol Chem. 2007 Apr 27;282(17):12796-803. doi: 10.1074/jbc.M610485200. Epub 2007 Mar 6. J Biol Chem. 2007. PMID: 17341586
-
Biological applications of phase-contrast electron microscopy.Methods Mol Biol. 2014;1117:385-99. doi: 10.1007/978-1-62703-776-1_18. Methods Mol Biol. 2014. PMID: 24357373 Review.
-
The vanilloid transient receptor potential channel TRPV4: from structure to disease.Prog Biophys Mol Biol. 2010 Sep;103(1):2-17. doi: 10.1016/j.pbiomolbio.2009.10.002. Epub 2009 Oct 14. Prog Biophys Mol Biol. 2010. PMID: 19835908 Review.
Cited by
-
Importance of non-selective cation channel TRPV4 interaction with cytoskeleton and their reciprocal regulations in cultured cells.PLoS One. 2010 Jul 19;5(7):e11654. doi: 10.1371/journal.pone.0011654. PLoS One. 2010. PMID: 20657843 Free PMC article.
-
Role of Known Transient Receptor Potential Vanilloid Channels in Modulating Cardiac Mechanobiology.Front Physiol. 2021 Oct 15;12:734113. doi: 10.3389/fphys.2021.734113. eCollection 2021. Front Physiol. 2021. PMID: 34867442 Free PMC article. Review.
-
Molecular mechanism of TRP channels.Compr Physiol. 2013 Jan;3(1):221-42. doi: 10.1002/cphy.c120001. Compr Physiol. 2013. PMID: 23720286 Free PMC article. Review.
-
Molecular architecture and subunit organization of TRPA1 ion channel revealed by electron microscopy.J Biol Chem. 2011 Nov 4;286(44):38168-38176. doi: 10.1074/jbc.M111.288993. Epub 2011 Sep 9. J Biol Chem. 2011. PMID: 21908607 Free PMC article.
-
Recent advances on the structure and the function relationships of the TRPV4 ion channel.Channels (Austin). 2024 Dec;18(1):2313323. doi: 10.1080/19336950.2024.2313323. Epub 2024 Feb 14. Channels (Austin). 2024. PMID: 38354101 Free PMC article. Review.
References
-
- Montell C. (2005) Sci. STKE 2005, re3. - PubMed
-
- Kedei N., Szabo T., Lile J. D., Treanor J. J., Olah Z., Iadarola M. J., Blumberg P. M. (2001) J. Biol. Chem. 276, 28613–28619 - PubMed
-
- Phelps C. B., Gaudet R. (2007) J. Biol. Chem. 282, 36474–36480 - PubMed
-
- Cahalan M. D. (2001) Nature 411, 542–543 - PubMed
-
- Clapham D. E. (2003) Nature 426, 517–524 - PubMed
Publication types
MeSH terms
Substances
LinkOut - more resources
Full Text Sources

