

StarD7 mediates the intracellular trafficking of phosphatidylcholine to mitochondria
- PMID: 20042613
- PMCID: PMC2844184
- DOI: 10.1074/jbc.M109.056960
StarD7 mediates the intracellular trafficking of phosphatidylcholine to mitochondria
Abstract
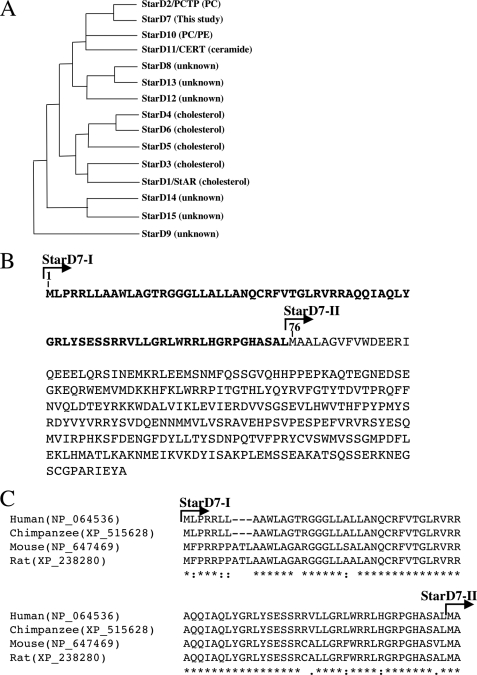
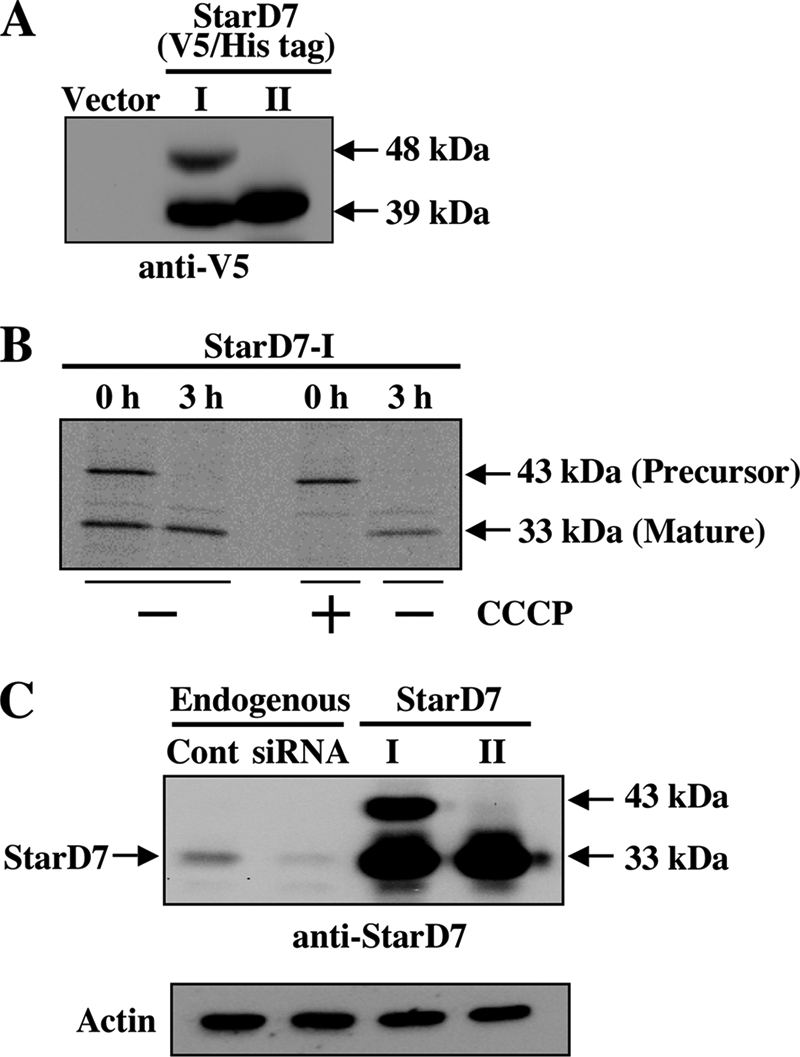
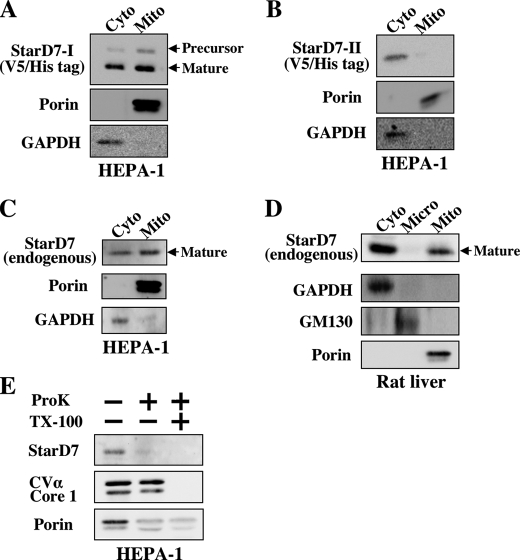
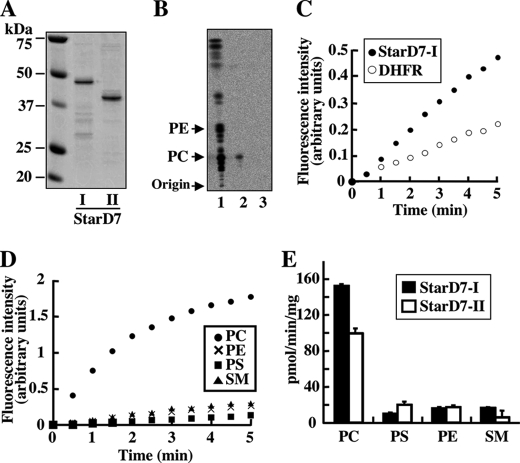
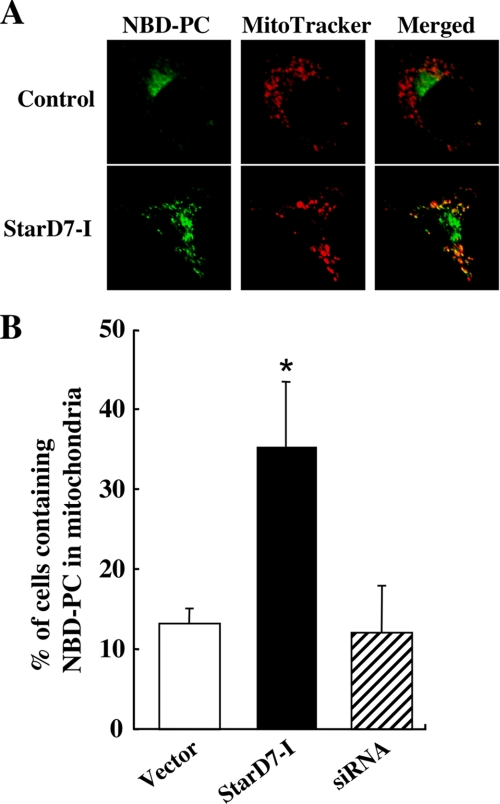
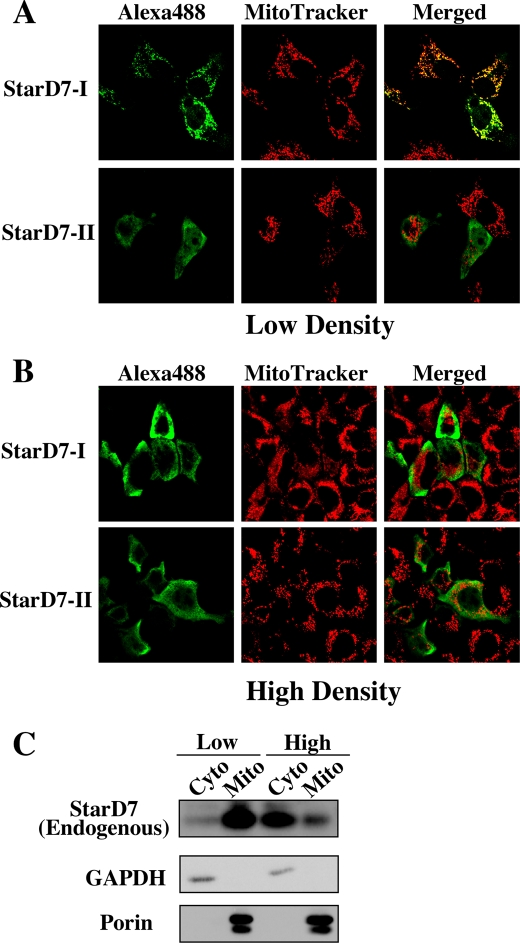
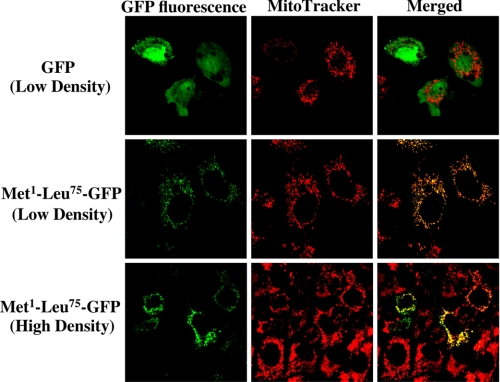
Steroidogenic acute regulatory protein-related lipid transfer (START) domains, found in 15 mammalian proteins termed StarD1-StarD15, are lipid-binding domains implicated in the intracellular lipid transport systems. In the present study, we analyzed the lipid ligand and function of StarD7. We found two variable forms of mammalian StarD7, termed StarD7-I and StarD7-II. Unlike StarD7-II, StarD7-I contained a mitochondrial-targeting sequence in its N terminus. Overexpressed StarD7-I tagged with V5/His in HEPA-1 cells was mainly observed in the mitochondria of cells prepared at low cellular density, but it was distributed in the cytoplasm of high density cells. StarD7-II was constantly distributed in the cytoplasm at any cellular density. Endogenous StarD7 in HEPA-1 cells and rat liver was also distributed in both the cytoplasm and the mitochondria. A protease K protection assay indicated that the mitochondrial StarD7 was associated with the outer mitochondrial membrane. The purified recombinant StarD7 specifically catalyzed the transfer of PC between lipid vesicles in vitro. Furthermore, the intracellular transport of fluorescent PC that was exogenously incorporated into the mitochondria was increased in cells that overexpressed StarD7-I. These results suggest that StarD7 facilitates the delivery of PC to mitochondria in non-vesicular system.
Figures
Similar articles
-
Identification of the N-terminal transmembrane domain of StarD7 and its importance for mitochondrial outer membrane localization and phosphatidylcholine transfer.Sci Rep. 2017 Aug 18;7(1):8793. doi: 10.1038/s41598-017-09205-1. Sci Rep. 2017. PMID: 28821867 Free PMC article.
-
StarD7 Protein Deficiency Adversely Affects the Phosphatidylcholine Composition, Respiratory Activity, and Cristae Structure of Mitochondria.J Biol Chem. 2016 Nov 25;291(48):24880-24891. doi: 10.1074/jbc.M116.736793. Epub 2016 Sep 30. J Biol Chem. 2016. PMID: 27694445 Free PMC article.
-
Role of the lipid transport protein StarD7 in mitochondrial dynamics.Biochim Biophys Acta Mol Cell Biol Lipids. 2021 Dec;1866(12):159029. doi: 10.1016/j.bbalip.2021.159029. Epub 2021 Aug 17. Biochim Biophys Acta Mol Cell Biol Lipids. 2021. PMID: 34416390
-
STARD1 Functions in Mitochondrial Cholesterol Metabolism and Nascent HDL Formation. Gene Expression and Molecular mRNA Imaging Show Novel Splicing and a 1:1 Mitochondrial Association.Front Endocrinol (Lausanne). 2020 Oct 20;11:559674. doi: 10.3389/fendo.2020.559674. eCollection 2020. Front Endocrinol (Lausanne). 2020. PMID: 33193082 Free PMC article. Review.
-
Mitochondrial cholesterol import.Biochim Biophys Acta Mol Cell Biol Lipids. 2017 Jan;1862(1):90-101. doi: 10.1016/j.bbalip.2016.08.012. Epub 2016 Aug 23. Biochim Biophys Acta Mol Cell Biol Lipids. 2017. PMID: 27565112 Review.
Cited by
-
Regulation and Essentiality of the StAR-related Lipid Transfer (START) Domain-containing Phospholipid Transfer Protein PFA0210c in Malaria Parasites.J Biol Chem. 2016 Nov 11;291(46):24280-24292. doi: 10.1074/jbc.M116.740506. Epub 2016 Oct 2. J Biol Chem. 2016. PMID: 27694132 Free PMC article.
-
Identification of a Plasmodium falciparum phospholipid transfer protein.J Biol Chem. 2013 Nov 1;288(44):31971-83. doi: 10.1074/jbc.M113.474189. Epub 2013 Sep 16. J Biol Chem. 2013. PMID: 24043620 Free PMC article.
-
Identification of the N-terminal transmembrane domain of StarD7 and its importance for mitochondrial outer membrane localization and phosphatidylcholine transfer.Sci Rep. 2017 Aug 18;7(1):8793. doi: 10.1038/s41598-017-09205-1. Sci Rep. 2017. PMID: 28821867 Free PMC article.
-
Mitochondrial membrane lipids in the regulation of bioenergetic flux.Cell Metab. 2024 Sep 3;36(9):1963-1978. doi: 10.1016/j.cmet.2024.07.024. Epub 2024 Aug 22. Cell Metab. 2024. PMID: 39178855 Free PMC article. Review.
-
Early steps in steroidogenesis: intracellular cholesterol trafficking.J Lipid Res. 2011 Dec;52(12):2111-2135. doi: 10.1194/jlr.R016675. Epub 2011 Oct 5. J Lipid Res. 2011. PMID: 21976778 Free PMC article. Review.
References
-
- Voelker D. R. (2003) J. Lipid Res. 44, 441–449 - PubMed
-
- Sprong H., van der Sluijs P., van Meer G. (2001) Nat. Rev. Mol. Cell Biol. 2, 504–513 - PubMed
-
- D'Angelo G., Polishchuk E., Di Tullio G., Santoro M., Di Campli A., Godi A., West G., Bielawski J., Chuang C. C., van der Spoel A. C., Platt F. M., Hannun Y. A., Polishchuk R., Mattjus P., De Matteis M. A. (2007) Nature 449, 62–67 - PubMed
-
- Hanada K., Kumagai K., Yasuda S., Miura Y., Kawano M., Fukasawa M., Nishijima M. (2003) Nature 426, 803–809 - PubMed
-
- Alpy F., Tomasetto C. (2005) J. Cell Sci. 118, 2791–2801 - PubMed
Publication types
MeSH terms
Substances
LinkOut - more resources
Full Text Sources
Molecular Biology Databases
