. 2010 May;51(5):1101-12.
doi: 10.1194/jlr.M002774. Epub 2009 Dec 29.

The gut microbiota modulates host energy and lipid metabolism in mice

Affiliations

The gut microbiota modulates host energy and lipid metabolism in mice

Vidya R Velagapudi et al. J Lipid Res. 2010 May.

Abstract

The gut microbiota has recently been identified as an environmental factor that may promote metabolic diseases. To investigate the effect of gut microbiota on host energy and lipid metabolism, we compared the serum metabolome and the lipidomes of serum, adipose tissue, and liver of conventionally raised (CONV-R) and germ-free mice. The serum metabolome of CONV-R mice was characterized by increased levels of energy metabolites, e.g., pyruvic acid, citric acid, fumaric acid, and malic acid, while levels of cholesterol and fatty acids were reduced. We also showed that the microbiota modified a number of lipid species in the serum, adipose tissue, and liver, with its greatest effect on triglyceride and phosphatidylcholine species. Triglyceride levels were lower in serum but higher in adipose tissue and liver of CONV-R mice, consistent with increased lipid clearance. Our findings show that the gut microbiota affects both host energy and lipid metabolism and highlights its role in the development of metabolic diseases.


Figures
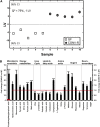
Fig. 1.
Fig. 1.
Serum metabolite profiles in CONV-R compared with GF mice. A: PLS/DA of serum metabolites from GF (n = 5) and CONV-R (n = 5) mice after a 4 h fast. Scores for latent variable LV1 and sample are depicted. Regression coefficients and VIP scores for the top ranked metabolites are listed in supplementary Table I. B: Selected serum metabolites that are significantly different in CONV-R (n = 5) compared with GF (n = 5) mice. For a complete list of microbially altered serum metabolites, see supplementary Table II. Data are expressed as mean values ± SEM. * P < 0.05; ** P < 0.01; and *** P < 0.001 compared with GF mice.
Fig. 2.
Fig. 2.
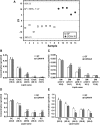
Serum lipidomic profiles in CONV-R compared with GF mice. A: PLS/DA of serum lipids from GF (n = 8) and CONV-R (n = 5) mice after a 4 h fast. Scores for latent variable LV1 and sample are depicted. Regression coefficients and VIP scores for the top ranked lipids are listed in supplementary Table III. B-E: Absolute concentrations of the most abundant cholesteryl esters (ChoE), sphingomyelins (SM), phosphatidylcholines (PC), and triglycerides (TG) in serum from GF and CONV-R mice. For a complete list of microbially altered serum lipids, see supplementary Table IV. Data are expressed as mean values ± SEM. * P < 0.05; ** P < 0.01; and *** P < 0.001 compared with GF mice.
Fig. 3.
Fig. 3.
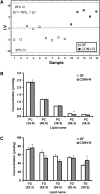
Lipidomic profiles of epidiymal adipose tissue in CONV-R compared with GF mice. A: PLS/DA of adipose lipids from GF (n = 9) and CONV-R (n = 5) mice after a 4 h fast. Scores for latent variable LV1 and sample are depicted. Regression coefficients and VIP scores for the top ranked lipids are listed in supplementary Table V. B–C: Absolute concentrations of the most abundant phosphatidylcholines (PC) and triglycerides (TG) in adipose tissue from GF and CONV-R mice. For a complete list of microbially altered adipose lipids, see supplementary Table VI. Data are expressed as mean values ± SEM. * P < 0.05 compared with GF mice.
Fig. 4.
Fig. 4.
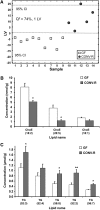
Lipidomic profiles of liver tissue in CONV-R compared with GF mice. A: PLS/DA of liver lipids from GF (n = 9) and CONV-R (n = 5) mice after a 4 h fast. Scores for latent variable LV1 and sample are depicted. Regression coefficients and VIP scores for the top ranked lipids are listed in supplementary Table VII. B–C: Absolute concentrations of the most abundant cholesteryl esters (ChoE) and triglycerides (TG) in liver tissue from GF and CONV-R mice. For a complete list of microbially altered liver lipids, see supplementary Table VIII. Data are expressed as mean values ± SEM. * P < 0.05; ** P < 0.01 compared with GF mice.
Fig. 5.
Fig. 5.
Serum lipoprotein profiles in CONV-R compared with GF mice. A: Representative agarose gel of the serum samples from GF (n = 4) and CONV-R (n = 5) mice where chylomicrons are at the origin, VLDLs in the preβ band, LDL in the β band, and HDL in the α band. B: Quantification of the agarose gels in (A). C: Total triglycerides measured in gel chromatography fractions of pooled serum (n = 5 per group) from GF and CONV-R mice after a 4 h fast. Fractions containing VLDL are indicated. D: Total cholesterol measured in the same gel chromatography fractions as in C. Fractions containing LDL and HDL are indicated. E: Triglycerides in serum from GF (n = 6) and CONV-R (n = 5) mice after an overnight fast and administration of Triton WR 1339. F: VLDL production rates based on data in E. Data are expressed as mean values ± SEM. * P < 0.05 compared with GF mice.
Fig. 6.
Fig. 6.
Postprandial lipid uptake in CONV-R and GF mice. A: Serum triglyceride levels in GF (n = 7–8/ time point) and CONV-R (n = 6/time point) before and 1 and 4 h after an intragastric cream (36% fat) bolus. B: Levels of chylomicron remnant levels in the same serum as in A analyzed by agarose gel electrophoresis. * P < 0.05 compared with GF mice.
Fig. 7.
Fig. 7.
Summary of the microbiota-induced changes in energy and lipid metabolism identified in our study. Energy metabolites are increased in the serum and are reflected by an upregulation of related genes in the liver transcriptome. Triglyceride (TG) levels are decreased in the serum and increased in adipose tissue and the liver of CONV-R mice after a 4 h fast. The serum reduction in TG is caused by a decrease in chylomicrons (CM). Lipid absorption is not reduced in CONV-R mice, and we propose that lipid clearance is increased. In agreement, we have previously shown that a microbiota increases suppression of angiopoietin-like protein 4/fasting-induced adipose factor (Angptl4/Fiaf) (16), an inhibitor of LPL, which will promote increased lipid clearance. VLDL production in the liver is increased in CONV-R mice, which may explain why VLDL-TG serum levels are not reduced in CONV-R mice despite increased clearance. Furthermore, phosphatidylcholine (16:0/18:1), which has been identified as a potent endogenous PPARα ligand, is increased in the serum and liver of CONV-R mice. Increased activation of PPARα may promote increased lipid clearance by inducing expression of LPL.

Similar articles

Cited by

References

    1. Eckburg P. B., Bik E. M., Bernstein C. N., Purdom E., Dethlefsen L., Sargent M., Gill S. R., Nelson K. E., Relman D. A. 2005. Diversity of the human intestinal microbial flora. Science. 308: 1635–1638. - PMC - PubMed
    1. Ley R. E., Backhed F., Turnbaugh P., Lozupone C. A., Knight R. D., Gordon J. I. 2005. Obesity alters gut microbial ecology. Proc. Natl. Acad. Sci. USA. 102: 11070–11075. - PMC - PubMed
    1. Ley R. E., Turnbaugh P. J., Klein S., Gordon J. I. 2006. Microbial ecology: human gut microbes associated with obesity. Nature. 444: 1022–1023. - PubMed
    1. Dethlefsen L., Huse S., Sogin M. L., Relman D. A. 2008. The pervasive effects of an antibiotic on the human gut microbiota, as revealed by deep 16S rRNA sequencing. PLoS Biol. 6: e280. - PMC - PubMed
    1. Ley R. E., Hamady M., Lozupone C., Turnbaugh P. J., Ramey R. R., Bircher J. S., Schlegel M. L., Tucker T. A., Schrenzel M. D., Knight R., et al. 2008. Evolution of mammals and their gut microbes. Science. 320: 1647–1651. - PMC - PubMed

Publication types

MeSH terms

LinkOut - more resources