. 2009 Dec 28;187(7):1023-36.
doi: 10.1083/jcb.200906084.

Regulation of OPA1 processing and mitochondrial fusion by m-AAA protease isoenzymes and OMA1

Affiliations

Regulation of OPA1 processing and mitochondrial fusion by m-AAA protease isoenzymes and OMA1

Sarah Ehses et al. J Cell Biol. .

Abstract

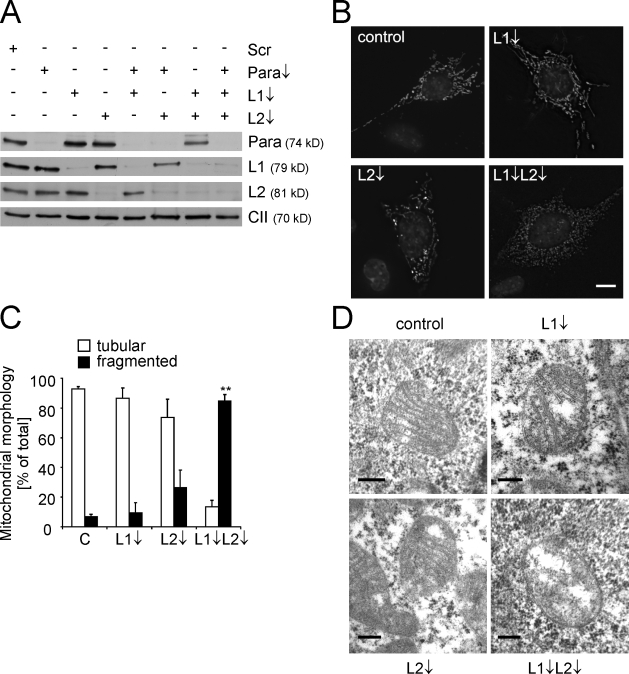
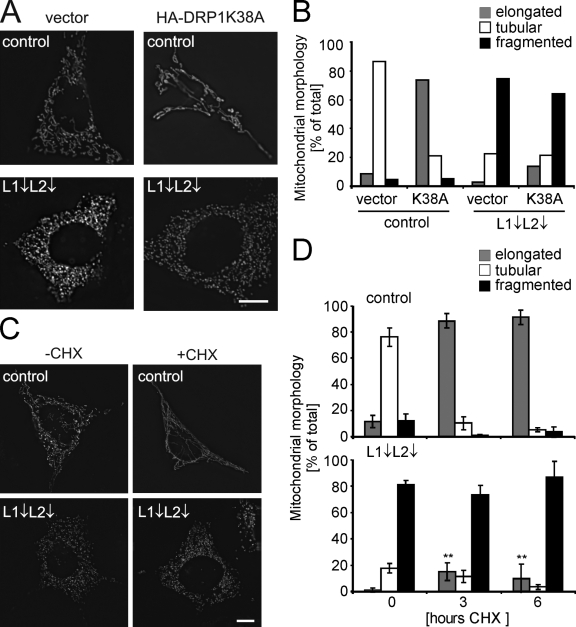
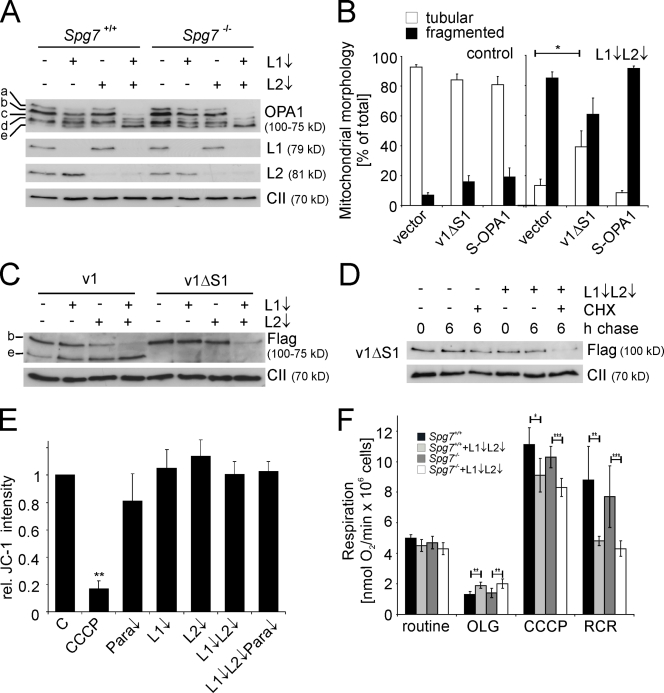
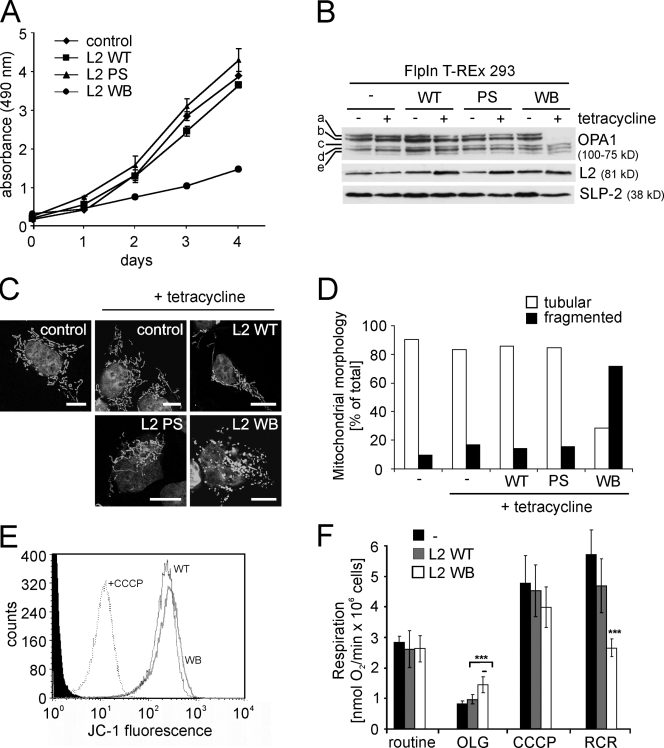
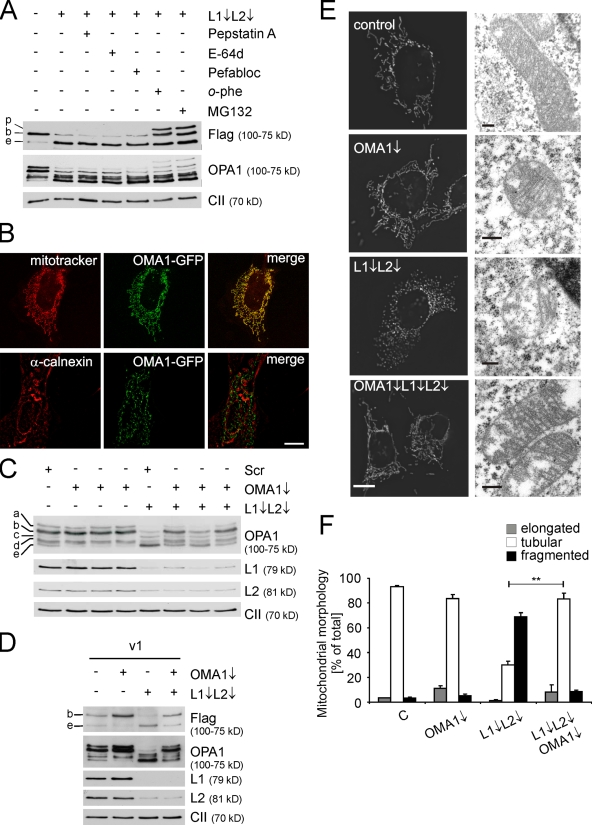
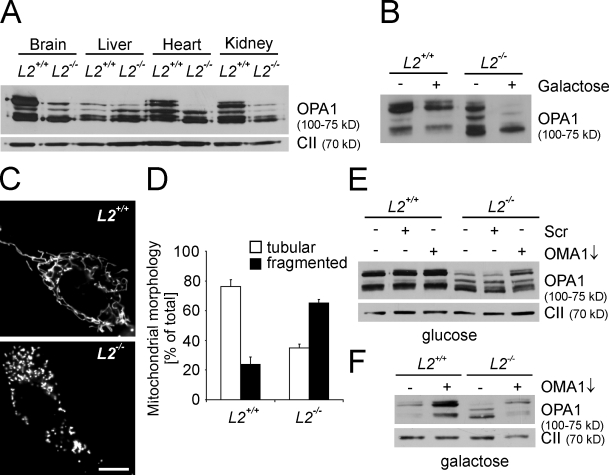
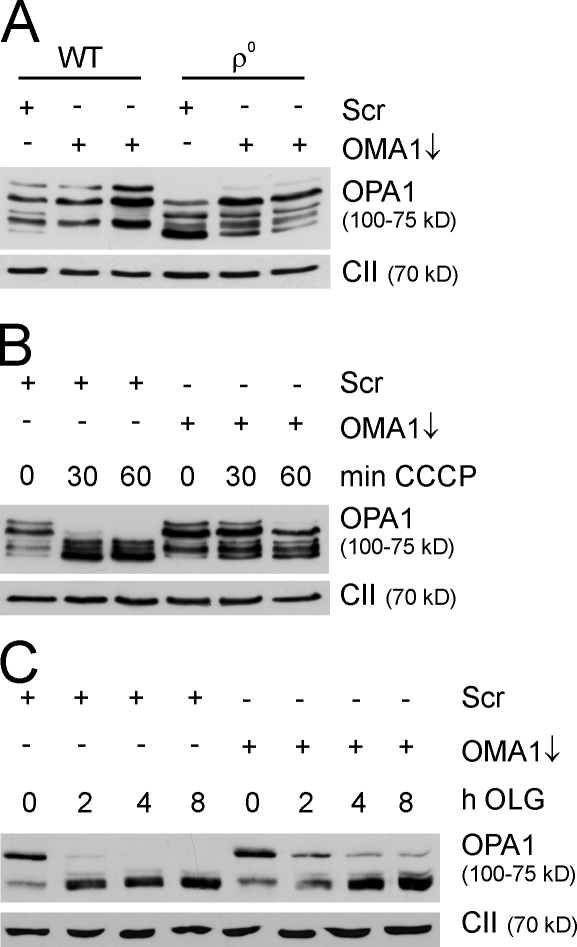
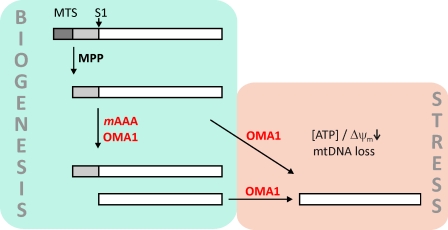
Mitochondrial fusion depends on the dynamin-like guanosine triphosphatase OPA1, whose activity is controlled by proteolytic cleavage. Dysfunction of mitochondria induces OPA1 processing and results in mitochondrial fragmentation, allowing the selective removal of damaged mitochondria. In this study, we demonstrate that two classes of metallopeptidases regulate OPA1 cleavage in the mitochondrial inner membrane: isoenzymes of the adenosine triphosphate (ATP)-dependent matrix AAA (ATPase associated with diverse cellular activities [m-AAA]) protease, variable assemblies of the conserved subunits paraplegin, AFG3L1 and -2, and the ATP-independent peptidase OMA1. Functionally redundant isoenzymes of the m-AAA protease ensure the balanced accumulation of long and short isoforms of OPA1 required for mitochondrial fusion. The loss of AFG3L2 in mouse tissues, down-regulation of AFG3L1 and -2 in mouse embryonic fibroblasts, or the expression of a dominant-negative AFG3L2 variant in human cells decreases the stability of long OPA1 isoforms and induces OPA1 processing by OMA1. Moreover, cleavage by OMA1 causes the accumulation of short OPA1 variants if mitochondrial DNA is depleted or mitochondrial activities are impaired. Our findings link distinct peptidases to constitutive and induced OPA1 processing and shed new light on the pathogenesis of neurodegenerative disorders associated with mutations in m-AAA protease subunits.


Figures

Figure 1.
Figure 1.
Fragmentation of mitochondria in MEFs depleted of AFG3L1 and -2. (A) Immunoblot analysis of MEFs transfected with siRNAs directed against AFG3L1 and -2 and paraplegin or scrambled siRNA (Scr) using specific antisera recognizing paraplegin (Para), AFG3L1 (L1), AFG3L2 (L2), and the 70-kD subunit of complex II (CII). (B and C) Mitochondrial morphology in AFG3L1- and AFG3L2-deficient MEFs was visualized by expression of mito-DsRed, and nuclear DNA was stained with DAPI. >150 MEFs were scored in each experiment. Bars represent means ± SD of three independent experiments (**, P < 0.01). (D) Mitochondrial ultrastructure in MEFs transfected with scrambled or AFG3L1- or AFG3L2-specific siRNAs or siRNAs against AFG3L1 and -2. Representative transmission electron micrographs of mitochondria are shown. Bars: (B) 10 µm; (D) 0.2 µm.
Figure 2.
Figure 2.
AFG3L1 and -2 are required for mitochondrial fusion. (A and B) Inhibition of fission does not restore a tubular network in the absence of AFG3L1 (L1) and AFG3L2 (L2). Dominant-negative DRP1K38A-HA and mito-DsRed were expressed in m-AAA protease–deficient MEFs, and mitochondrial morphology was assessed after 24 h. >200 cells were scored per experiment. (C and D) SIMH depends on AFG3L1 and -2. After depletion of AFG3L1 and -2, MEFs were incubated for 3 (C and D) and 6 h (D) in the presence of 1 µM CHX (+CHX) as indicated. >150 cells were scored for each experiment. Bars represent means ± SD of three independent experiments (**, P < 0.01). Bars, 10 µm.
Figure 3.
Figure 3.
Destabilization of long OPA1 isoforms in the absence of the m-AAA protease. (A) Immunoblot analysis of Spg7+/+ and Spg7−/− MEFs depleted of AFG3L1 (L1) and AFG3L2 (L2) as indicated. Cells lysates were analyzed with antibodies directed against OPA1, AFG3L1 and -2 and, for control, the 70-kD subunit of complex II (CII). OPA1 isoforms are marked with a–e. (B) Mitochondrial morphology in AFG3L1/AFG3L2-deficient MEFs expressing OPA1 variants. Before depletion of AFG3L1 and -2, MEFs were transfected with plasmids encoding Flag-tagged OPA1 variants v1ΔS1 or S-OPA1. >150 cells were scored. Bars represent means ± SD of three independent experiments (*, P < 0.05). (C) Immunoblot analysis of AFG3L1/AFG3L2-deficient MEFs expressing Flag-tagged OPA1 splice variants 1 (v1) and 1ΔS1 (v1ΔS1). Cell lysates were analyzed 3 d after siRNA transfection by SDS-PAGE and immunoblotting using anti-Flag and anti–complex II antibodies. (D) Degradation of v1ΔS1 in AFG3L1/AFG3L2-depleted MEFs. 2 d after siRNA transfection, cells were incubated for 6 h with 100 µg/ml CHX and analyzed as described in C. (E) Mitochondrial membrane potential in MEFs depleted of m-AAA protease subunits was analyzed with the fluorescent dye JC-1 and flow cytometry at 590 nm. Dissipation of the membrane potential with CCCP was used as a control. Relative intensities to cells transfected with scrambled RNAi (C) are shown. Data represent means ± SD of three independent experiments (**, P < 0.01). Para, paraplegin. (F) Oxygen consumption in Spg7+/+ and Spg7−/− MEFs depleted of AFG3L1/AFG3L2 was measured under routine conditions and in the presence of oligomycin (OLG) and CCCP. Bars represent means ± SD of three independent experiments (*, P < 0.05; **, P < 0.01; ***, P < 0.001).
Figure 4.
Figure 4.
Expression of dominant-negative AFG3L2E408Q inhibits cell proliferation and impairs mitochondrial morphology and OPA1 processing. (A) Growth of cells expressing AFG3L2 (L2 WT), AFG3L2E575Q (L2 PS), or AFG3L2E408Q (L2 WB). Graphs represent means ± SD of three independent experiments. (B) Immunoblot analysis of FlpIn T-REx 293 cells expressing AFG3L2 variants. Cell lysates were analyzed 24 h after the addition of tetracycline using antibodies directed against OPA1, AFG3L2, and SLP-2. (C and D) Mitochondrial morphology in cells expressing AFG3L2 variants. >100 cells were scored. WT, AFG3L2; PS, AFG3L2E575Q; WB, AFG3L2E408Q. (E) Membrane potential in cells expressing AFG3L2 (WT) or AFG3L2E408Q (WB). (F) Oxygen consumption in cells expressing AFG3L2 (WT) or AFG3L2E408Q (WB) measured as in Fig. 3 F. Error bars represent the means ± SD of a minimum of three independent experiments (***, P < 0.001). Bars, 10 µm.
Figure 5.
Figure 5.
OMA1 degrades OPA1 in AFG3L1/AFG3L2-deficient MEFs. (A) Stability of OPA1 and OPA1 variant 1 in the presence of different protease inhibitors. Flag-tagged OPA1 variant 1 was expressed in MEFs that were subsequently depleted of AFG3L1 (L1) and AFG3L2 (L2). After 48 h, MEFs were incubated for 5 h with pepstatin A, E-64d, Pefabloc SC, o-phe, or MG132, and cell lysates were analyzed by immunoblotting with α-Flag, α-OPA1, and α–complex II. p, OPA1 precursor; b, long OPA1 isoform; e, short OPA1 isoform. (B) Localization of OMA1 to mitochondria. Fluorescence microscopy of MEFs expressing murine OMA1 harboring a C-terminal GFP tag. Mitochondria were stained with MitoTracker red CMXRos, whereas the ER was detected using an antiserum directed against calnexin. (C) Immunoblot analysis of MEFs transfected with siRNAs directed against AFG3L1 and -2 and OMA1 or scrambled siRNA (Scr) using specific antisera recognizing OPA1, AFG3L1 and -2, and the 70-kD subunit of complex II (CII). Three different siRNAs directed against OMA1 were used. (D) Immunoblot analysis of MEFs transfected with siRNAs directed against AFG3L1/AFG3L2 and OMA1 and Flag-tagged OPA1 splice variant 1 (v1). Cell lysates were analyzed 3 d after transfection by SDS-PAGE and immunoblotting using α-Flag, α-AFG3L1, α-AFG3L2, α-OPA1, and α–complex II antibodies. (E) Mitochondrial morphology in MEFs transfected with AFG3L1/AFG3L2 and OMA1 siRNA was visualized by expression of mito-DsRed (left). Mitochondrial ultrastructure was analyzed by electron microscopy. (F) Quantification of mitochondrial morphology. >150 MEFs were scored in each immunofluorescence experiment. Bars represent means ± SD of three independent experiments (**, P < 0.01). Bars: (B) 10 µm; (E) 0.2 µm.
Figure 6.
Figure 6.
Impaired OPA1 processing in Afg3l2−/− mice. (A) Immunoblot analysis of mitochondria isolated from the brain, liver, heart, and kidney of WT (L2+/+) or Afg3l2−/− (L2−/−) mice using antisera directed against OPA1 and the 70-kD subunit of complex II (CII). (B) Immunoblot analysis of OPA1 in WT or Afg3l2−/− primary MEFs grown in the presence of glucose or galactose. (C and D) Mitochondrial morphology in WT or Afg3l2−/− cells was visualized by expression of a mitochondrially targeted GFP. >100 cells were scored. Bas represent means ± SD of three independent experiments. (E and F) Stabilization of long OPA1 isoforms in Afg3l2−/− MEFs grown in glucose or galactose upon down-regulation of OMA1. Immunoblot analysis was performed using specific antisera recognizing OPA1 and complex II. Scr, scrambled RNAi. Bar, 10 µm.
Figure 7.
Figure 7.
Mitochondrial dysfunction induces OPA1 processing by OMA1. (A) OMA1 stabilizes long OPA1 isoforms in the absence of mtDNA. Immunoblot analysis of human osteosarcoma cells (143B) using specific antisera recognizing OPA1 and the 70-kD subunit of complex II (CII). Cells lacking mtDNA (ρ0) were transfected with OMA1-specific or scrambled (Scr) siRNA and compared with parental cells containing mtDNA (WT). Cell lysates were analyzed 72 h after transfection. (B and C) Stabilization of long OPA1 isoforms against CCCP (B)- and oligomycin (OLG; C)-induced processing in OMA1-depleted MEFs. MEFs transfected with OMA1-specific or scrambled siRNA were incubated after 48 h with 20 µM CCCP or after 60 h with 2 µM oligomycin for the indicated time periods. Cell lysates were analyzed by SDS-PAGE and immunoblotted with antibodies directed against OPA1 and complex II.
Figure 8.
Figure 8.
Two peptidases regulate OPA1 cleavage at S1. Newly imported OPA1 molecules are processed by the mitochondrial processing peptidase (MPP) in the matrix space (Ishihara et al., 2006). The stability of long OPA1 isoforms depends on m-AAA protease isoenzymes containing AFG3L1 and -2, which ensure the balanced formation of long and short OPA1 isoforms upon S1 cleavage and maintain mitochondrial fusion. The m-AAA protease itself may act as a processing peptidase for OPA1 or promote constitutive cleavage by OMA1. At decreased mitochondrial ATP levels, after dissipation of Δψm, or in the absence of mtDNA, OMA1 promotes stress-induced OPA1 processing, resulting in the complete conversion of long OPA1 isoforms to short variants. Constitutive cleavage of OPA1 at site 2 is not depicted. MTS, mitochondrial targeting sequence.

Similar articles

Cited by

References

    1. Akepati V.R., Müller E.C., Otto A., Strauss H.M., Portwich M., Alexander C. 2008. Characterization of OPA1 isoforms isolated from mouse tissues. J. Neurochem. 106:372–383 10.1111/j.1471-4159.2008.05401.x - DOI - PubMed
    1. Amati-Bonneau P., Milea D., Bonneau D., Chevrollier A., Ferré M., Guillet V., Gueguen N., Loiseau D., de Crescenzo M.A., Verny C., et al. 2009. OPA1-associated disorders: phenotypes and pathophysiology. Int. J. Biochem. Cell Biol. 41:1855–1865 10.1016/j.biocel.2009.04.012 - DOI - PubMed
    1. Augustin S., Gerdes F., Lee S., Tsai F.T., Langer T., Tatsuta T. 2009. An intersubunit signaling network coordinates ATP hydrolysis by m-AAA proteases. Mol. Cell. 35:574–585 10.1016/j.molcel.2009.07.018 - DOI - PMC - PubMed
    1. Bao Y.C., Tsuruga H., Hirai M., Yasuda K., Yokoi N., Kitamura T., Kumagai H. 2003. Identification of a human cDNA sequence which encodes a novel membrane-associated protein containing a zinc metalloprotease motif. DNA Res. 10:123–128 10.1093/dnares/10.3.123 - DOI - PubMed
    1. Baricault L., Ségui B., Guégand L., Olichon A., Valette A., Larminat F., Lenaers G. 2007. OPA1 cleavage depends on decreased mitochondrial ATP level and bivalent metals. Exp. Cell Res. 313:3800–3808 10.1016/j.yexcr.2007.08.008 - DOI - PubMed

Publication types

MeSH terms