. 2010 Feb 1;184(3):1268-79.
doi: 10.4049/jimmunol.0903218. Epub 2009 Dec 28.

Development of promyelocytic zinc finger and ThPOK-expressing innate gamma delta T cells is controlled by strength of TCR signaling and Id3

Affiliations

Development of promyelocytic zinc finger and ThPOK-expressing innate gamma delta T cells is controlled by strength of TCR signaling and Id3

Eric S Alonzo et al. J Immunol. .

Abstract

The broad-complex tramtrack and bric a brac-zinc finger transcriptional regulator (BTB-ZF), promyelocytic leukemia zinc finger (PLZF), was recently shown to control the development of the characteristic innate T cell phenotype and effector functions of NK T cells. Interestingly, the ectopic expression of PLZF was shown to push conventional T cells into an activated state that seems to be proinflammatory. The factors that control the normal expression of PLZF in lymphocytes are unknown. In this study, we show that PLZF expression is not restricted to NK T cells but is also expressed by a subset of gammadelta T cells, functionally defining distinct subsets of this innate T cell population. A second BTB-ZF gene, ThPOK, is important for the phenotype of the PLZF-expressing gammadelta T cells. Most importantly, TCR signal strength and expression of inhibitor of differentiation gene 3 control the frequency of PLZF-expressing gammadelta T cells. This study defines the factors that control the propensity of the immune system to produce potentially disease-causing T cell subsets.


Conflict of interest statement

Disclosures

The authors have no financial conflicts of interest.

Figures
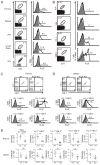
FIGURE 1
FIGURE 1
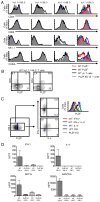
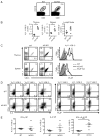
The majority of PLZF is expressed by Vγ1.1+Vδ6.3+ T cells. Intracellular staining for PLZF in γδ T cells in primary tissues, secondary tissues, and iIELs (A), in Vγ4 (FITC), Vδ4 (FITC), Vγ1.1 (Biotin), and Vδ6.3 (PE) γδ thymocytes (B), and in γδ T cell subsets bearing indicated γδ TCR heterodimers in thymus (C) and splenocytes (D) in WT (open curves) or PLZF-deficient mice (shaded curves). Numbers adjacent to outlined areas indicate the percentage of γδ T cells; bracketed lines next to graphs specify the percent total of PLZF-positive cells. γδ T cell subsets were identified with anti-CD3 PerCP-Cy5.5, anti-γδ TCR APC, anti-Vδ6.3 TCR PE, and anti-Vγ1.1 TCR biotin/streptavidin PE-Cy7. E, Absolute numbers of total γδ T cells and γδ subsets in the thymus and spleen of WT littermates (n = 6) and PLZF-deficient mice (n = 6; error bars represent the SD). Approximately 3 × 10⁶ events were acquired for these experiments. Doublet exclusion was done as indicated in the Materials and Methods. Data are representative of more than six independent experiments. All flow cytometry plots are quantified in log10 fluorescence. Each symbol represents an individual mouse. *p = 0.05; **p < 0.05.
FIGURE 2
FIGURE 2
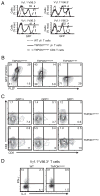
Phenotype and function of PLZF-positive and -negative Vγ1.1+Vδ6.3+ T cells. A, Expression of CD44 (APC), CD69 (PerCP-Cy5.5), NK1.1 (PerCP-Cy5.5), and CD62L (APC-Alexa Fluor 750) by WT PLZF-positive (red), PLZF-negative (blue or black), and PLZF-deficient (gray) γδ thymocytes. B, CD4 (APC-Cy7) and CD8 (Pacific Blue) expression on WT Vγ1.1+Vδ6.3+ T cells compared with intracellular staining for PLZF. C, Intracellular staining for IFN-γ (PE-Cy7), IL-4 (APC), and PLZF (Alexa Fluor 488) in Vδ6.3 T cells following activation. Numbers indicate the percentage of cells in each quadrant. D, Cytokine analysis of supernatants of 5 × 10⁴ FACS-sorted Vδ6.3+ and Vδ6.3 T cells from WT and PLZF-deficient splenocytes with plate-bound anti-CD3 for 3 d. Error bars represent the SD. ***p = 0.05. Data are representative of six (A and B) or five (C and D) independent experiments. γδ T cell subsets were identified with anti-CD3 PerCP-Cy5.5, anti-γδ TCR biotin, and anti-Vδ6.3 TCR PE. Doublet exclusion was done as indicated in the Materials and Methods. All flow cytometry plots are quantified in log10 fluorescence.
FIGURE 3
FIGURE 3
Variable ThPOK expression in γδ T cell subsets. A, ThPOK-GFP reporter expression in spleen γδ T cells and CD4 T cells WT and ThPOKGFP/WT. Numbers in quadrants indicate the percentage of γδ T cells that express GFP. B, GFP (ThPOK) and PLZF expression in spleen cells from ThPOKGFP/+ and ThPOKGFP/GFP mice. C, Expression of CD4 (APC-Cy7) and CD8 (Pacific Blue) in Vγ1.1+Vδ6.3+ splenocytes from ThPOKGFP/WT and ThPOKGFP/KO reporter mice. D, INF-γ and IL-4 expression in spleen Vγ1.1+Vδ6.3+ T cells from WT or ThPOK-deficient (ThPOKko/ko) mice following activation with PMA/ionomycin. γδ T cell subsets were identified with anti-CD3 (PerCP-Cy5.5), anti-γδ TCR (APC), anti-Vδ6.3 TCR (PE), and anti-Vγ1.1 TCR (biotin/streptavidin PE-Cy7). Approximately 3 × 10⁶ events were acquired for these experiments. Doublet exclusion was done as indicated in the Materials and Methods. B–D, Numbers indicate the percentage of cells in each quadrant. Data are representative of at least two experiments. All flow cytometry plots are quantified in log10 fluorescence.
FIGURE 4
FIGURE 4
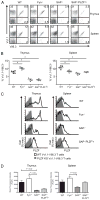
Vγ1.1+Vδ6.3+ T cells in Fyn- and SAP-deficient mice and SAP-deficient PLZF-transgenic mice. A, FACS analysis of indicated γδ subsets thymocytes (top) and splenocytes (bottom) in indicated mouse strains. B, Percent frequency of Vγ1.1+Vδ6.3+ T cells among thymocytes (left) and splenocytes (right) from WT (n = 5), Fyn-deficient (n = 4), SAP-deficient (n = 4), and SAP-deficient PLZF-transgenic (n = 4) mice. Each symbol represents an individual mouse. *p = 0.05. C, PLZF expression in Vγ1.1+Vδ6.3+ thymocytes (left) and splenocytes (right) in indicated mouse strains. D, Mean fluorescence intensity (W/m2) of PLZF levels in Vγ1.1+ Vδ6.3+ thymocytes: WT = 2559 ±1049; Fyn KO = 3464 ± 1407; SAP KO = 517 ± 127; SAP KO-PLZF Tg = 856 ± 171; Vγ1.1+Vδ6.3+ spleen cells: WT = 527 ±187; Fyn KO = 715 ± 186; SAP KO = 316 ± 69; SAP KO-PLZF Tg = 494 ± 72. Error bars represent the SD. γδ T cell subsets were identified with anti-CD3 (PerCP-Cy5.5), anti-γδ TCR (APC), anti-Vδ6.3 TCR (PE), and anti-Vγ1.1 TCR (biotin/streptavidin PE-Cy7). Approximately 3 × 10⁶ events were acquired for these experiments. Doublet exclusion was done as indicated in the Materials and Methods. Data are representative of at least three experiments. All flow cytometry plots are quantified in log10 fluorescence.
FIGURE 5
FIGURE 5
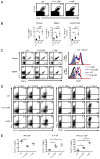
Reduced strength of TCR signal enhances the development of Vγ1.1+Vδ6.3+ T cells. A, Frequency of γδ T cells in the thymuses from WT, SLP-76 Y112:128F (Y112:128F), and SLP-76 Y145F mutant mice (Y145). B, The absolute numbers of indicated γδ subsets in the thymus, spleen, and lymph nodes of the indicated mouse strains. C, The frequency of γδ subsets and PLZF expression analysis in Vγ1.1+Vδ6.3+ T cells from thymocytes and splenocytes of WT, Y112:128F, and Y145F mice. D, Intracellular staining for IFN-γ (Pacific Blue) and IL-4 (Alexa Fluor 488; left panel) or TNF-α (Alexa Fluor 488) and PLZF (Pacific Blue; right panel) in indicated γδ subsets from pooled splenocytes and lymphocytes in WT (top), Y112:128F (middle), and Y145F (bottom) mice. E, The frequency of Vγ1.1+Vδ6.3+ T cells that are SPs for IFN-γ (left) and IL-4 (middle) or DPs (right) for IFN-γ and IL-4 from WT, Y112:128F, and Y145F mice. γδ T cell subsets were identified with anti-CD3 (PerCP-Cy5.5), anti-γδ TCR (APC), anti-Vδ6.3 TCR (PE), and anti-Vγ1.1 TCR (biotin/streptavidin PE-Cy7). Approximately 6 × 10⁶ events per file were collected for these experiments. Multiple files were concatenated in FloJo software. Doublet exclusion was done as indicated in the Materials and Methods. Each symbol represents an individual mouse. *p = 0.05. Error bars represent the SD. All flow cytometry plots are quantified in log10 fluorescence.
FIGURE 6
FIGURE 6
Id3 controls the development of PLZF-expressing Vγ1.1+Vδ6.3+ T cells. A, The frequency of γδ T cells in the thymuses from WT and Id3-deficient (Id3 KO) mice. B, The absolute numbers of Vγ1.1+Vδ6.3+ T cells in the thymus, spleen, and lymph nodes of WT and Id3 KO mice. *p = 0.0005. C, The frequency of γδ T cell subsets in WT and Id3 KO mice (left) and PLZF expression analysis of Vγ1.1+Vδ6.3+ thymocytes and splenocytes of WT and Id3 KO mice (right). D, Intracellular staining for IFN-γ (Pacific Blue) and IL-4 (Alexa Fluor 488; left panel) or TNF-α (Alexa Fluor 488) and PLZF (Pacific Blue; right panel) in indicated γδ subsets from pooled splenocytes and lymphocytes in WT (top) and Id3 KO (bottom) mice. E, The frequency of Vγ1.1+Vδ6.3+ T cells that are SPs for IFN-γ (left) and IL-4 (middle) or DPs for IFN-γ and IL-4 (right) in WT and Id3 KO mice. γδ T cell subsets were identified with anti-CD3 (PerCP-Cy5.5), anti-γδ TCR (APC), anti-Vδ6.3 TCR (PE), and anti-Vγ1.1 TCR (biotin/streptavidin PE-Cy7). Approximately 6 × 10⁶ events per file were collected for these experiments. Multiple files were concatenated in FloJo software. Doublet exclusion was done as indicated in the Materials and Methods. Data are representative of at least four experiments. Error bars represent the SD. All flow cytometry plots are quantified in log10 fluorescence.

Similar articles

Cited by

References

    1. Taghon T, Yui MA, Pant R, Diamond RA, Rothenberg EV. Developmental and molecular characterization of emerging β- and gammadelta-selected pre-T cells in the adult mouse thymus. Immunity. 2006;24:53–64. - PubMed
    1. Hayday AC. [γ][δ] cells: a right time and a right place for a conserved third way of protection. Annu Rev Immunol. 2000;18:975–1026. - PubMed
    1. Li W, Kim MG, Gourley TS, McCarthy BP, Sant’Angelo DB, Chang CH. An alternate pathway for CD4 T cell development: thymocyte-expressed MHC class II selects a distinct T cell population. Immunity. 2005;23:375–386. - PubMed
    1. Lewis JM, Girardi M, Roberts SJ, Barbee SD, Hayday AC, Tigelaar RE. Selection of the cutaneous intraepithelial gammadelta+ T cell repertoire by a thymic stromal determinant. Nat Immunol. 2006;7:843–850. - PubMed
    1. Boyden LM, Lewis JM, Barbee SD, Bas A, Girardi M, Hayday AC, Tigelaar RE, Lifton RP. Skint1, the prototype of a newly identified immunoglobulin superfamily gene cluster, positively selects epidermal gammadelta T cells. Nat Genet. 2008;40:656–662. - PMC - PubMed

Publication types

MeSH terms

Substances

LinkOut - more resources