Changes in the pattern of DNA methylation associate with twin discordance in systemic lupus erythematosus
- PMID: 20028698
- PMCID: PMC2813473
- DOI: 10.1101/gr.100289.109
Changes in the pattern of DNA methylation associate with twin discordance in systemic lupus erythematosus
Abstract
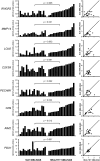
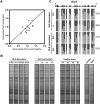
Monozygotic (MZ) twins are partially concordant for most complex diseases, including autoimmune disorders. Whereas phenotypic concordance can be used to study heritability, discordance suggests the role of non-genetic factors. In autoimmune diseases, environmentally driven epigenetic changes are thought to contribute to their etiology. Here we report the first high-throughput and candidate sequence analyses of DNA methylation to investigate discordance for autoimmune disease in twins. We used a cohort of MZ twins discordant for three diseases whose clinical signs often overlap: systemic lupus erythematosus (SLE), rheumatoid arthritis, and dermatomyositis. Only MZ twins discordant for SLE featured widespread changes in the DNA methylation status of a significant number of genes. Gene ontology analysis revealed enrichment in categories associated with immune function. Individual analysis confirmed the existence of DNA methylation and expression changes in genes relevant to SLE pathogenesis. These changes occurred in parallel with a global decrease in the 5-methylcytosine content that was concomitantly accompanied with changes in DNA methylation and expression levels of ribosomal RNA genes, although no changes in repetitive sequences were found. Our findings not only identify potentially relevant DNA methylation markers for the clinical characterization of SLE patients but also support the notion that epigenetic changes may be critical in the clinical manifestations of autoimmune disease.
Figures


Similar articles
-
Nucleic Acid-Sensing and Interferon-Inducible Pathways Show Differential Methylation in MZ Twins Discordant for Lupus and Overexpression in Independent Lupus Samples: Implications for Pathogenic Mechanism and Drug Targeting.Genes (Basel). 2021 Nov 26;12(12):1898. doi: 10.3390/genes12121898. Genes (Basel). 2021. PMID: 34946847 Free PMC article.
-
X-chromosome inactivation in monozygotic twins with systemic lupus erythematosus.Autoimmunity. 1997;26(2):85-93. doi: 10.3109/08916939709003851. Autoimmunity. 1997. PMID: 9546817
-
Concordance of autoimmune disease in a nationwide Danish systemic lupus erythematosus twin cohort.Semin Arthritis Rheum. 2018 Feb;47(4):538-544. doi: 10.1016/j.semarthrit.2017.06.007. Epub 2017 Jun 23. Semin Arthritis Rheum. 2018. PMID: 28755788
-
Epigenetic Methods and Twin Studies.Adv Exp Med Biol. 2020;1253:95-104. doi: 10.1007/978-981-15-3449-2_3. Adv Exp Med Biol. 2020. PMID: 32445092 Review.
-
Epigenetic alterations in autoimmune rheumatic diseases.Nat Rev Rheumatol. 2011 May;7(5):263-71. doi: 10.1038/nrrheum.2011.16. Epub 2011 Feb 22. Nat Rev Rheumatol. 2011. PMID: 21343899 Review.
Cited by
-
Autoimmune disease in the epigenetic era: how has epigenetics changed our understanding of disease and how can we expect the field to evolve?Expert Rev Clin Immunol. 2015 Jan;11(1):45-58. doi: 10.1586/1744666X.2015.994507. Expert Rev Clin Immunol. 2015. PMID: 25534978 Free PMC article. Review.
-
Inflammasome and Mitophagy Connection in Health and Disease.Int J Mol Sci. 2020 Jul 1;21(13):4714. doi: 10.3390/ijms21134714. Int J Mol Sci. 2020. PMID: 32630319 Free PMC article. Review.
-
Epigenetics and the transition from acute to chronic pain.Pain Med. 2012 Nov;13(11):1474-90. doi: 10.1111/j.1526-4637.2012.01488.x. Epub 2012 Sep 14. Pain Med. 2012. PMID: 22978429 Free PMC article. Review.
-
DNA methylation signatures in development and aging of the human prefrontal cortex.Am J Hum Genet. 2012 Feb 10;90(2):260-72. doi: 10.1016/j.ajhg.2011.12.020. Epub 2012 Feb 2. Am J Hum Genet. 2012. PMID: 22305529 Free PMC article.
-
Biomarkers for kidney involvement in pediatric lupus.Biomark Med. 2015;9(6):529-43. doi: 10.2217/bmm.15.25. Biomark Med. 2015. PMID: 26079958 Free PMC article. Review.
References
-
- Al-Shahrour F, Diaz-Uriarte R, Dopazo J. FatiGO: A web tool for finding significant associations of Gene Ontology terms with groups of genes. Bioinformatics. 2004;20:578–580. - PubMed
-
- Benjamini Y, Hochberg Y. Controlling the false discovery rate: A practical and powerful approach to multiple testing. J R Stat Soc Ser B Methodol. 1995;57:289–300.
Publication types
MeSH terms
Substances
Grants and funding
- AR049084/AR/NIAMS NIH HHS/United States
- N01AR62277/AR/NIAMS NIH HHS/United States
- AR42460/AR/NIAMS NIH HHS/United States
- P30 AR053483/AR/NIAMS NIH HHS/United States
- R01 AI031584/AI/NIAID NIH HHS/United States
- R01 AI024717/AI/NIAID NIH HHS/United States
- N01-AR62277/AR/NIAMS NIH HHS/United States
- P01 AR049084/AR/NIAMS NIH HHS/United States
- AI31584/AI/NIAID NIH HHS/United States
- P20 RR020143/RR/NCRR NIH HHS/United States
- RR020143/RR/NCRR NIH HHS/United States
- AI24717/AI/NIAID NIH HHS/United States
- R37 AI024717/AI/NIAID NIH HHS/United States
- R01 AR042460/AR/NIAMS NIH HHS/United States
LinkOut - more resources
Full Text Sources
Other Literature Sources
Medical
Molecular Biology Databases
