G+C content dominates intrinsic nucleosome occupancy
- PMID: 20028554
- PMCID: PMC2808325
- DOI: 10.1186/1471-2105-10-442
G+C content dominates intrinsic nucleosome occupancy
Abstract
Background: The relative preference of nucleosomes to form on individual DNA sequences plays a major role in genome packaging. A wide variety of DNA sequence features are believed to influence nucleosome formation, including periodic dinucleotide signals, poly-A stretches and other short motifs, and sequence properties that influence DNA structure, including base content. It was recently shown by Kaplan et al. that a probabilistic model using composition of all 5-mers within a nucleosome-sized tiling window accurately predicts intrinsic nucleosome occupancy across an entire genome in vitro. However, the model is complicated, and it is not clear which specific DNA sequence properties are most important for intrinsic nucleosome-forming preferences.
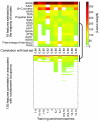
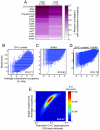
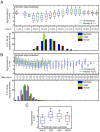
Results: We find that a simple linear combination of only 14 simple DNA sequence attributes (G+C content, two transformations of dinucleotide composition, and the frequency of eleven 4-bp sequences) explains nucleosome occupancy in vitro and in vivo in a manner comparable to the Kaplan model. G+C content and frequency of AAAA are the most important features. G+C content is dominant, alone explaining approximately 50% of the variation in nucleosome occupancy in vitro.
Conclusions: Our findings provide a dramatically simplified means to predict and understand intrinsic nucleosome occupancy. G+C content may dominate because it both reduces frequency of poly-A-like stretches and correlates with many other DNA structural characteristics. Since G+C content is enriched or depleted at many types of features in diverse eukaryotic genomes, our results suggest that variation in nucleotide composition may have a widespread and direct influence on chromatin structure.
Figures


Similar articles
-
Modeling interactions between adjacent nucleosomes improves genome-wide predictions of nucleosome occupancy.Bioinformatics. 2009 Jun 15;25(12):i348-55. doi: 10.1093/bioinformatics/btp216. Bioinformatics. 2009. PMID: 19478009 Free PMC article.
-
Blurring of high-resolution data shows that the effect of intrinsic nucleosome occupancy on transcription factor binding is mostly regional, not local.PLoS Comput Biol. 2010 Jan 22;6(1):e1000649. doi: 10.1371/journal.pcbi.1000649. PLoS Comput Biol. 2010. PMID: 20098497 Free PMC article.
-
Global remodeling of nucleosome positions in C. elegans.BMC Genomics. 2013 Apr 26;14:284. doi: 10.1186/1471-2164-14-284. BMC Genomics. 2013. PMID: 23622142 Free PMC article.
-
Chromatin 'programming' by sequence--is there more to the nucleosome code than %GC?J Biol. 2009;8(11):96. doi: 10.1186/jbiol207. Epub 2009 Dec 23. J Biol. 2009. PMID: 20067596 Free PMC article. Review.
-
Predicting nucleosome positioning in genomes: physical and bioinformatic approaches.Biophys Chem. 2011 May;155(2-3):53-64. doi: 10.1016/j.bpc.2011.03.006. Epub 2011 Apr 9. Biophys Chem. 2011. PMID: 21482020 Review.
Cited by
-
Controls of nucleosome positioning in the human genome.PLoS Genet. 2012;8(11):e1003036. doi: 10.1371/journal.pgen.1003036. Epub 2012 Nov 15. PLoS Genet. 2012. PMID: 23166509 Free PMC article.
-
The yin and yang of yeast transcription: elements of a global feedback system between metabolism and chromatin.PLoS One. 2012;7(6):e37906. doi: 10.1371/journal.pone.0037906. Epub 2012 Jun 7. PLoS One. 2012. PMID: 22685547 Free PMC article.
-
Evolution of nucleosome occupancy: conservation of global properties and divergence of gene-specific patterns.Mol Cell Biol. 2011 Nov;31(21):4348-55. doi: 10.1128/MCB.05276-11. Epub 2011 Sep 6. Mol Cell Biol. 2011. PMID: 21896781 Free PMC article.
-
Nucleosome positioning in Saccharomyces cerevisiae.Microbiol Mol Biol Rev. 2011 Jun;75(2):301-20. doi: 10.1128/MMBR.00046-10. Microbiol Mol Biol Rev. 2011. PMID: 21646431 Free PMC article. Review.
-
Evolutionary divergence of intrinsic and trans-regulated nucleosome positioning sequences reveals plastic rules for chromatin organization.Genome Res. 2011 Nov;21(11):1851-62. doi: 10.1101/gr.122267.111. Epub 2011 Sep 13. Genome Res. 2011. PMID: 21914852 Free PMC article.
References
Publication types
MeSH terms
Substances
LinkOut - more resources
Full Text Sources
Other Literature Sources
Molecular Biology Databases

