. 2010 Mar 25;29(12):1787-97.
doi: 10.1038/onc.2009.468. Epub 2009 Dec 21.

TGFbeta-mediated upregulation of hepatic miR-181b promotes hepatocarcinogenesis by targeting TIMP3

Affiliations

TGFbeta-mediated upregulation of hepatic miR-181b promotes hepatocarcinogenesis by targeting TIMP3

B Wang et al. Oncogene. .

Abstract

To identify microRNAs (miRNAs) that may have a causal role in hepatocarcinogenesis, we used an animal model in which C57BL/6 mice fed choline-deficient and amino acid defined (CDAA) diet develop preneoplastic lesions at 65 weeks and hepatocellular carcinomas after 84 weeks. miRNA expression profiling showed significant upregulation of miR-181b and miR-181d in the livers of mice as early as 32 weeks that persisted at preneoplastic stage. The expression of tissue inhibitor of metalloprotease 3 (TIMP3), a tumor suppressor and a validated miR-181 target, was markedly suppressed in the livers of mice fed CDAA diet. Upregulation of hepatic transforming growth factor (TGF)beta and its downstream mediators Smad 2, 3 and 4 and increase in phospho-Smad2 in the liver nuclear extract correlated with elevated miR-181b/d in mice fed CDAA diet. The levels of the precursor and mature miR-181b were augmented on exposure of hepatic cells to TGFbeta and were significantly reduced by small interference RNA-mediated depletion of Smad4, showing the involvement of TGFbeta signaling pathway in miR-181b expression. Ectopic expression and depletion of miR-181b showed that miR-181b enhanced matrix metallopeptidases (MMP)2 and MMP9 activity and promoted growth, clonogenic survival, migration and invasion of hepatocellular carcinoma (HCC) cells that could be reversed by modulating TIMP3 level. Further, depletion of miR-181b inhibited tumor growth of HCC cells in nude mice. miR-181b also enhanced resistance of HCC cells to the anticancer drug doxorubicin. On the basis of these results, we conclude that upregulation of miR-181b at early stages of feeding CDAA diet promotes hepatocarcinogenesis.


Figures

Figure 1
Figure 1. MicroRNA-181b/d expression is upregulated at early stages of hepatocarcinogenesis
A. Relative expression of miR-181b/d in the livers of mice on control or CDAA diet for 6, 18, 32 and 65 weeks as determined by microarray analysis. Total RNA from 5 mice of each group was used for microarray analysis, which was described previously (11). B. Real-time RT-PCR analysis of miR-181a/b/c/d expression in mouse livers using Taqman primers and probe. Single and double asterisks denote P≤0.05 and ≤0.01, respectively.
Figure 2
Figure 2. TIMP3 is a target of miR-181b
A. TIMP3, a candidate target of miR-181b, was downregulated in the livers of mice fed CDAA diet. i. Western blot analysis of TIMP3 expression in moue liver. Mouse liver tissue extracts were immunoblotted with anti-TIMP3, and GAPDH antibodies. ii. Realtime RT-PCR analysis of TIMP3 mRNA level in 32 and 65 weeks mouse liver. B. Overexpression of miR-181b in Hep3B (i) and Sk-Hep1 (ii) cells reduced TIMP3 levels. Cells were transfected with pre-miR-181b (25nM) or negative control RNA (NC) followed by assay of miR-181b, protein and mRNA levels of TIMP3, respectively. iii. Depletion of endogenous miR-181b from SK-Hep1 cells with anti-miR-181b increased TIMP3 mRNA and protein levels. Cells were transfected with 60nM anti-miR-181b followed by measurements of miR-181b and protein/RNA levels of TIMP3. C. MMP activity assay. Twenty and forty microliters of serum free medium from SK-Hep1 cells transfected with negative control (NC) or pre-miR-181b, and anti-miR-181b or control anti-miR (anti-NC) respectively was resolved on Zymogram gel, followed by renaturation, development and Coomassie staining. The amount of gelatin digested reflects the activity of MMPs. D. Luciferase assay. i. Expression of miR-181b in Hep3B cells transfected with anti-miR-181b or anti-NC. Ii. Hep3B cells were cotransfected with the reporters and anti-miR-181b (60nM) or negative control RNA (NC). After 48h RLU1/RLU2 activity was measured.
Figure 3
Figure 3. TGFβ upregulates hepatic miR-181b
A. Real-time RT-PCR analysis of the expression of TGFβ and its downstream mediators in mice fed CDAA diet for 32 and 65 weeks. B. Western blot analysis of phospho-Smad2, Smad2 and Smad4 expression in the nuclear extracts from 32 weeks mice liver. Quantification of the expression was normalized to Ku-70. C. i. Real-time RT-PCR analysis of miR-181b expression in cells treated with TGFβ (20ng/ml for HepG2, 5ng/ml for Hep3B, and 10ng/ml for hepatocytes and Huh7) for 24h. ii-iv. The kinetics of miR-181a/b/d response to TGFβ. HepG2 cells were treated with TGFβ for different time points (0-24h) and subjected to real-time RT-PCR analysis of miR-181a/b/d. D. Knockdown of Smad4 by siRNA interferes with miR-181b expression. HepG2 and Huh7 cells were transfected with Smad4 specific siRNA followed by real-time RT-PCR analysis of Smad4 and miR-181b after 48h in the absence or presence of TGFβ.
Figure 4
Figure 4. miR-181b enhances tumorigenic properties of HCC cells
A. miR-181b promotes HCC cell growth in culture. Hep3B and SNU-182 cells were transfected with pre-miR-181b or control miR (25nM), and anti-miR or control RNA (60 nM), respectively followed by MTT assay. The left panels present real-time RT-PCR analysis of miR-181b in HCC cells. B. Clonogenic survival of HCC cells increased upon ectopic expression of miR-181b. Hep3B (500 cells) or HepG2 (750 cells) transfected with miR-181b or control miR, SK-Hep1 (500 cells) transfected with anti-miR or control RNA, were plated in 60mm dishes and colonies formed after 2 weeks were stained with crystal violet and counted. C. miR-181b promotes HCC cell migration. HCC cells were loaded onto the top well of a trans-well inserts for cell migration assay. After 24h, cells that migrated to the bottom chamber containing serum-supplemented medium were stained with Hema-3, and counted. D. Depletion of miR-181b in SK-Hep1 cells reduces cell invasion. SK-Hep1 cells were transfected with anti-miR or control RNA followed by invasion assay using trans-well chamber. Invaded cells were stained after 48h and photographed under microscope.
Figure 5
Figure 5. TIMP3 is involved in miR-181b-promoted colony formation and invasion in HCC cells
A. Overexpression of TIMP3 abrogated miR-181b-enhanced colony formation in Hep3B cells. Hep3B cells transfected with miR-181b or NC were further transfected with TIMP3 expressing vector p3xFlag-TIMP3 or empty vector. Then, cells were subjected to colony formation assay, and proteins were extracted from the cells following Flag western blot. B. and C. Knocking down TIMP3 rescued colony formation and invasive ability in SK-Hep1 cells transfected with anti-miR-181b. SK-Hep1 cells were first transfected with anti-miR-181b or anti-NC, and then with siTIMP3 or siNC, followed by western blot analysis, colony formation and invasion assays.
Figure 6
Figure 6. Depletion of miR-181b suppresses tumor growth in nude mice
A. Tumors formed in nude mice. SK-Hep1 cells (5×10⁶) transfected with anti-miR-181b or anti-NC were subcutaneously injected into nude mice. Tumors were harvested after 6 weeks. B. Statistic analysis of tumor weight. C. Real-time RT-PCR analysis of miR-181b expression in SK-Hep1 cells and tumors. D. Western blot analysis of TIMP3 expression in tumors. Proteins were extracted from tumors and subjected to Western blot analysis.
Figure 7
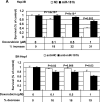
Figure 7. miR-181b enhances resistance to doxorubicin in HCC cells
A. MTT assay of HCC cells in the presence of doxorubicin. Cells were seeded in 96-well plates with a density of 5×10³ cells/well for Hep3B and 3×10³ cells/well for SK-Hep1. After 24h, Doxorubicin was added at different concentration (0-1.0 μM) and cells were allowed to grow for another 72h followed by MTT assay. The absorbance at 595 nm of treated cells was divided by that of the untreated cells (which was taken as 100%) to assess the percentage of growth that was then plotted as a function of the Doxorubicin concentration. B and C. Clonogenic survival of HCC cells in the absence or presence of doxorubicin. Hep3B (500 cells) and SK-Hep1 (500 cells) were subjected to clonogenic survival assay in the absence or presence of doxorubicin (1ng/ml).

Similar articles

Cited by

References

    1. Aravalli RN, Steer CJ, Cressman EN. Molecular mechanisms of hepatocellular carcinoma. Hepatology. 2008;48:2047–63. - PubMed
    1. Bartel DP. MicroRNAs: target recognition and regulatory functions. Cell. 2009;136:215–33. - PMC - PubMed
    1. Calin GA, Pekarsky Y, Croce CM. The role of microRNA and other non-coding RNA in the pathogenesis of chronic lymphocytic leukemia. Best Pract Res Clin Haematol. 2007;20:425–37. - PubMed
    1. Carthew RW, Sontheimer EJ. Origins and Mechanisms of miRNAs and siRNAs. Cell. 2009;136:642–55. - PMC - PubMed
    1. Cheung O, Puri P, Eicken C, Contos MJ, Mirshahi F, Maher JW, et al. Nonalcoholic steatohepatitis is associated with altered hepatic MicroRNA expression. Hepatology. 2008;48:1810–1820. - PMC - PubMed

Publication types

MeSH terms

Substances