. 2010 Jan 20;29(2):457-68.
doi: 10.1038/emboj.2009.368. Epub 2009 Dec 10.

FOG-1-mediated recruitment of NuRD is required for cell lineage re-enforcement during haematopoiesis

Affiliations

FOG-1-mediated recruitment of NuRD is required for cell lineage re-enforcement during haematopoiesis

Zhiguang Gao et al. EMBO J. .

Abstract

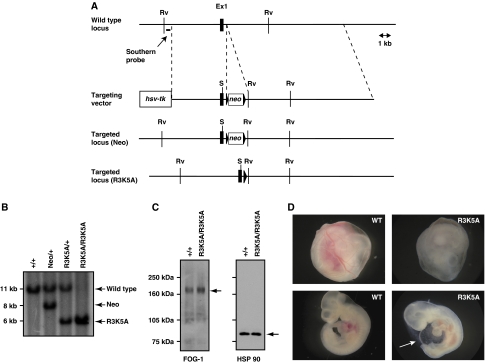
The transcriptional co-factor Friend of GATA1 (FOG-1) has been shown to interact with subunits of the nucleosome remodelling and histone deacetylase (NuRD) complex through a specific motif located at its N-terminus. To test the importance of FOG-1/NuRD interaction for haematopoiesis in vivo, we generated mice with a mutation that specifically disrupts FOG-1/NuRD interaction (FOG-1(R3K5A)). Homozygous FOG-1(R3K5A) mice were found to have splenomegaly, extramedullary erythropoiesis, granulocytosis and thrombocytopaenia secondary to a block in megakaryocyte maturation. FOG-1(R3K5A/R3K5A) megakaryocytes and erythroid progenitors expressed increased levels of GATA2, showing that FOG-1/NuRD interaction is required for the earlier described 'GATA Switch'. In addition, ablation of FOG-1/NuRD interaction led to inappropriate expression of mast cell and eosinophil-specific genes in the megakaryocyte and erythroid lineages. Chromatin immunoprecipitation experiments revealed that the NuRD complex was not properly recruited to a mast cell gene promoter in FOG-1(R3K5A/R3K5A) megakaryocytes, suggesting that FOG-1/NuRD interaction is required for the direct suppression of mast cell gene expression. Taken together, these results underscore the importance of the FOG-1/NuRD interaction for the re-enforcement of lineage commitment during erythropoiesis and megakaryopoiesis in vivo.


Conflict of interest statement

The authors declare that they have no conflict of interest.

Figures

Figure 1
Figure 1
Mutations in the N-terminus of FOG-1 abrogate FOG-mediated repression of GATA1 activity. In (A), a schematic of the FOG-1 protein, with its nine zinc-finger domains indicated by loops. The sequence of the first 12 amino acids of FOG-1 is indicated, with the sequence of the R3K5A mutation shown below. In (B), quantitation of in vitro binding assays using purified GST (circles), GST-FOG-1 (triangles) or GST-FOG-1R3K5A (diamonds) fusion proteins with increasing amounts in vitro translated MTA1. In (C), NIH 3T3 fibroblasts were transfected with a reporter construct containing the mast cell-specific FcɛR1β promoter driving expression of human growth hormone. Fibroblasts were also transfected with expression vectors encoding GATA1, FOG-1 and FOG-1R3K5A as indicated. Forty-eight hours after transfection, cell media was assayed for human growth hormone expression as described in Materials and methods. The results are reported as the mean±s.e.m. (n=6). A * indicates statistical significance (P=0.006).
Figure 2
Figure 2
Generation of mice with an FOG-1 mutation that disrupts FOG-1/NuRD interaction. In (A), a schematic of the targeting strategy used to generate the FOG-1R3K5A mutation. In (B), southern analysis of genomic DNA from mice containing the FOG-1 alleles shown in (A). Arrows indicate the position of the expected fragment for each allele. In (C), western analysis of whole bone marrow cell lysates from wild-type and FOG-1R3K5A/R3K5A mice using an antibody against FOG-1 (left panel), or HSP 90 (right panel) as a loading control. In (D), photographs of wild-type (left panels) or FOG-1R3K5A/R3K5A (right panels) embryos at E10.5 with their yolk sac intact (top panels), or dissected free (bottom panels). Note the pale yolk sack and pericardial oedema (arrow) of the FOG-1R3K5A/R3K5A embryo.
Figure 3
Figure 3
Aberrant erythropoiesis in FOG-1R3K5A/R3K5A mice. In (A), gross morphology of spleens from wild-type and mutant mice reveal splenomegaly in the FOG-1R3K5A/R3K5A mice. In (B), quantitation of spleen/body weight ratio of wild-type (n=11) and FOG-1R3K5A/R3K5A (n=15) spleens. In panel (C), haematoxylin and eosin staining of splenic sections from wild-type (left panel) and FOG-1R3K5A/R3K5A (right panel) mice. Note the dramatic increase in red pulp (RP) seen in the FOG-1R3K5A/R3K5A spleens. ‘WP' indicates white pulp. In (D), erythroid colony-formation assays using cells from both bone marrow and spleen of wild-type or FOG-1R3K5A/R3K5A mice. The results are reported as the mean±s.e.m. (n=4). A * indicates statistical significance (P<0.05). In (E), representative FACS analysis of whole bone marrow or spleen from wild-type or FOG-1R3K5A/R3K5A mice using the erythroid markers CD71 and Ter119. Numbers beside each gate (red boxes) indicate the percentage of the total number of cells analysed.
Figure 4
Figure 4
Increased granulopoiesis in FOG-1R3K5A/R3K5A mice. In (A), haematoxylin and eosin staining of sections through the sternum of wild-type (left panel) and FOG-1R3K5A/R3K5A (right panel) mice. Note the paucity of megakaryocytes (arrows) and increased number of granulocytes in the FOG-1R3K5A/R3K5A bone marrow (see inset). In (B), representative FACS analysis of whole bone marrow from wild-type (left panel) or FOG-1R3K5A/R3K5A mice (right panel) using the granulocytic markers GR-1 and Mac-1. In (C) and (D), granulocyte-macrophage colony-forming assays using bone marrow or spleen from wild-type or FOG-1R3K5A/R3K5A mice in the presence (C) or absence (D) of GM-CSF. The results are reported as the mean±s.e.m. (n=4) and * indicates a statistically significant difference in means (P<0.03).
Figure 5
Figure 5
Defective megakaryopoiesis in FOG-1R3K5A/R3K5A mice. In (A), May–Grünwald–Giemsa staining of peripheral blood smears from wild-type (left panel) and FOG-1R3K5A/R3K5A (right panel) mice. FOG-1R3K5A/R3K5A mice have much fewer, but larger platelets in the peripheral blood than their wild-type littermates (arrows). In (B), representative FACS analysis of whole bone marrow (top panels) or spleen (bottom panels) from wild-type (left panels) or FOG-1R3K5A/R3K5A (right panels) mice using the megakaryocyte marker CD41. Numbers within each gate (red boxes) indicate the percentage of the total number of cells analysed. In (C), polyploidy analysis of megakaryocytes from wild-type (left) or FOG-1R3K5A/R3K5A (right) mice. In (D), megakaryocyte colony-forming assays using cells from bone marrow or spleen from wild-type or FOG-1R3K5A/R3K5A mice. The results are reported as the mean±s.e.m. (n=4) and * indicates a statistically significant difference in means (P<0.007). In (E), photographs of megakaryocyte colonies derived from wild-type (left panel) and FOG-1R3K5A/R3K5A (right panel) megakaryocyte colony-forming assays stained for acetylcholinesterase (Ach) expression (brown). Note the decreased numbers of Ach+ cells per colony seen in colonies derived from FOG-1R3K5A/R3K5A mice as quantitated in (F).
Figure 6
Figure 6
Up-regulation of GATA2 and mast cell-specific genes in FOG-1R3K5A/R3K5A megakaryocytes. In (A), results of quantitative RT–PCR on RNA prepared from primary megakaryocyte cultures derived from wild-type and FOG-1R3K5A/R3K5A bone marrow using primers specific for the indicated genes. The results are reported as the mean±s.e.m. of the ratio of expression levels between FOG-1R3K5A/R3K5A and wild-type megakaryocytes. A * indicates a statistically significant difference from 1.00. In (B), results of quantitative RT–PCR on total RNA from CD71hiTer119hi erythroblasts using primers specific for the indicated genes. In (C), Lin bone marrow derived cells from FOG-1R3K5A/R3K5A mice were transduced with a retrovirus expressing an shRNA directed against GATA2 or with a control retrovirus. Three days after transduction, RNA was prepared and subject to quantitative RT–PCR with primers specific for the indicated genes. The results are reported as the mean±s.e.m. of the ratio of gene expression levels between FOG-1R3K5A/R3K5A cells transduced with the anti-GATA2 shRNA encoding retrovirus (white bars) or cells transduced with the control virus (black bars) relative to wild-type cells transduced with the control virus. A * indicates a statistically significant difference in relative expression between anti-GATA2 shRNA retrovirus transduced cells and control virus transduced cells.
Figure 7
Figure 7
Recruitment of MTA2 to the FcɛR1β gene promoter is disrupted by the FOG-1R3K5A mutation. An FOG-1-deficient haematopoietic cell line was transduced with a retrovirus encoding wild-type FOG-1 (A) or FOG-1R3K5A (B). Stably transduced cells were selected and differentiated along the megakaryocyte lineage using thrombopoietin and then subject to chromatin immunoprecipitation using an antibody against the NuRD subunit MTA2 (black bars) or control IgG (white bars) followed by quantitative RT–PCR with primers specific for the FcɛR1β promoter or the GAPDH promoter. The results are reported the mean±s.e.m. of immunoprecipitation relative to total input chromatin.

Similar articles

Cited by

References

    1. Anguita E, Hughes J, Heyworth C, Blobel GA, Wood WG, Higgs DR (2004) Globin gene activation during haemopoiesis is driven by protein complexes nucleated by GATA-1 and GATA-2. EMBO J 23: 2841–2852 - PMC - PubMed
    1. Cantor AB, Iwasaki H, Arinobu Y, Moran TB, Shigematsu H, Sullivan MR, Akashi K, Orkin SH (2008) Antagonism of FOG-1 and GATA factors in fate choice for the mast cell lineage. J Exp Med 205: 611–624 - PMC - PubMed
    1. Cantor AB, Katz SG, Orkin SH (2002) Distinct domains of the GATA-1 cofactor FOG-1 differentially influence erythroid versus megakaryocytic maturation. Mol Cell Biol 22: 4268–4279 - PMC - PubMed
    1. Cismasiu VB, Adamo K, Gecewicz J, Duque J, Lin Q, Avram D (2005) BCL11B functionally associates with the NuRD complex in T lymphocytes to repress targeted promoter. Oncogene 24: 6753–6764 - PubMed
    1. Crispino JD, Lodish MB, MacKay JP, Orkin SH (1999) Use of altered specificity mutants to probe a specific protein-protein interaction in differentiation: the GATA-1:FOG complex. Mol Cell 3: 219–228 - PubMed

Publication types

MeSH terms