. 2010 Feb 17;29(4):795-805.
doi: 10.1038/emboj.2009.371. Epub 2009 Dec 10.

FANCM regulates DNA chain elongation and is stabilized by S-phase checkpoint signalling

Affiliations

FANCM regulates DNA chain elongation and is stabilized by S-phase checkpoint signalling

Sarah Luke-Glaser et al. EMBO J. .

Abstract

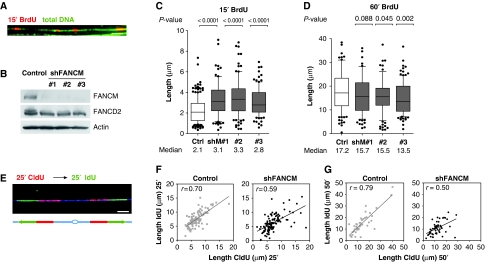
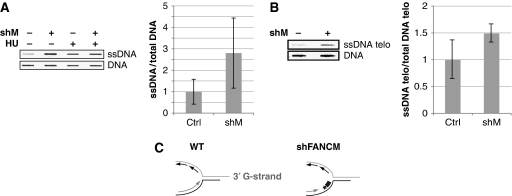
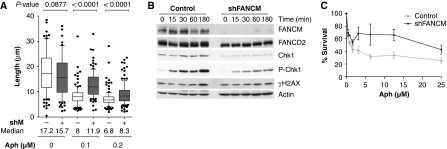
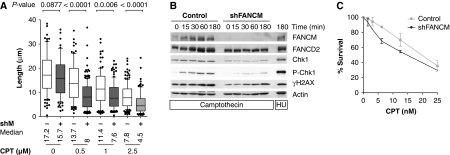
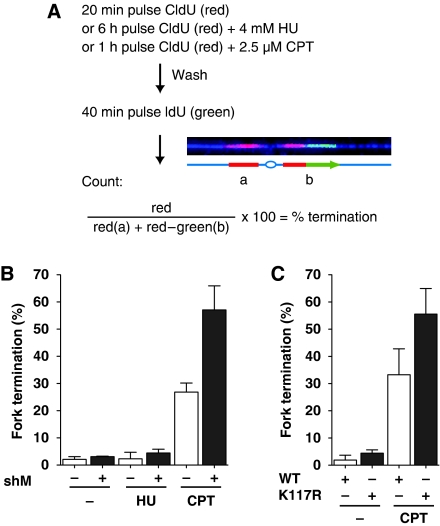
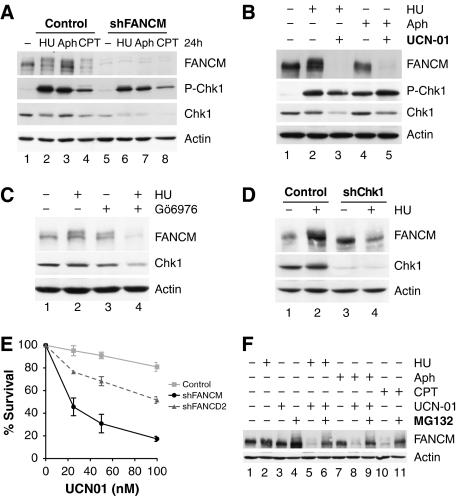
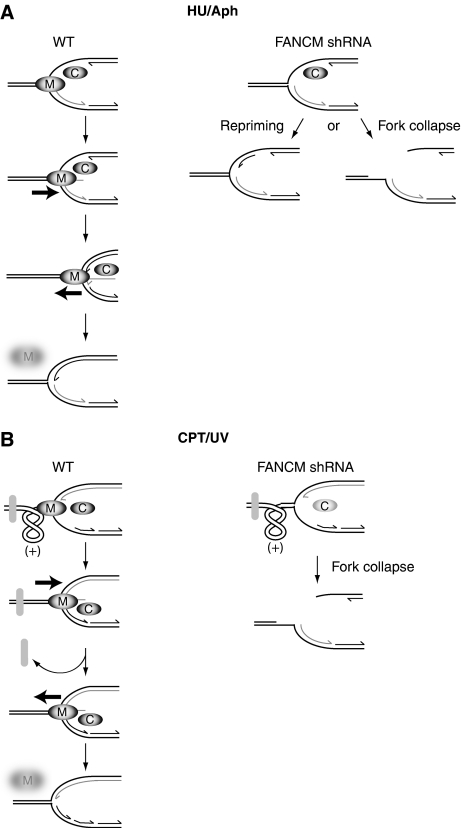
FANCM binds and remodels replication fork structures in vitro. We report that in vivo, FANCM controls DNA chain elongation in an ATPase-dependent manner. In the presence of replication inhibitors that do not damage DNA, FANCM counteracts fork movement, possibly by remodelling fork structures. Conversely, through damaged DNA, FANCM promotes replication and recovers stalled forks. Hence, the impact of FANCM on fork progression depends on the underlying hindrance. We further report that signalling through the checkpoint effector kinase Chk1 prevents FANCM from degradation by the proteasome after exposure to DNA damage. FANCM also acts in a feedback loop to stabilize Chk1. We propose that FANCM is a ringmaster in the response to replication stress by physically altering replication fork structures and by providing a tight link to S-phase checkpoint signalling.


Conflict of interest statement

The authors declare that they have no conflict of interest.

Figures

Figure 1
Figure 1
FANCM controls DNA chain elongation. (A) HeLa cells were labelled for 15 min with BrdU, DNA was stretched out on glass slides and newly synthesized DNA was revealed by immunofluorescence (red). Total DNA was visualized with an antibody against guanosine (green). The bar represents 10 μm. (B) The knockdown of FANCM in HeLa cells was verified 3 days after transfection by western blot with an antibody against FANCM. The depletion of FANCM was confirmed by reduced monoubiquitination of FANCD2 (slower migrating band is absent in lanes 2–4). To induce the monoubiquitination of FANCD2, cells were exposed to 1 μM aphidicolin for 1 h. Actin was used as a loading control. (C) Graphic representation of the 15-min BrdU track lengths measured in μm (y axis, n>100 for each condition). The bar dissecting the box represents the median of the data points, the whiskers span the 10- and 90%-percentile and the dots represent data points that lay outside these percentiles. The P-values relative to the pSUPER-puro control cells were determined by Mann–Whitney test and are depicted above the graph. Three shFANCM plasmids (shM#1, 2 and 3) were used to deplete FANCM. (D) HeLa cells were pulse labelled with BrdU for 60 min and track length was plotted on the y axis. Three different oligonucleotides against the FANCM sequence were used to knock down FANCM protein levels. The median of track length for all shFANCM constructs used was shorter than for control cells. For plasmids shFANCM #2 and #3, the distribution of track length was significantly different as determined by Mann–Whitney test (P-values above graph). (E) Replication forks were pulse labelled with two pulses of equal length of 25 min or 50 min; The first pulse (CldU) was revealed in red and the second (IdU) in green. The integrity of the fibres was assessed with an antibody against guanosine (blue). The bar represents 5 μm. (F) DNA of control and FANCM shRNA HeLa cells were labelled with a 25-min CldU pulse, followed by an IdU pulse of equal length. Note that the data points are more dispersed for FANCM shRNA cells compared with control cells. (G) The length of the first 50 min (CldU) pulse was plotted on the x axis and the value for the second 50 min pulse (IdU) on the y axis (n>50). The linear regression is represented with a bold line. The correlation coefficient r is represented in the top left corner.
Figure 2
Figure 2
FANCM prevents the accumulation of ssDNA. (A) DNA from shFANCM and control HeLa cells was extracted under non-denaturing conditions and slot blotted. ssDNA was revealed by western blotting with an antibody that recognizes guanosine only in its ssDNA state. To control DNA loading, the membrane was denatured and blotted with the same antibody against guanosine. HU treatment was used as positive control for ssDNA formation. (B) Native DNA extracts were blotted as before, and telomeric ssDNA was revealed by Southern blotting with a radiolabelled G-rich probe (TTAGGG). The membrane was denatured and blotted with the same probe as loading control. (C) Cartoon representing a replication fork progressing towards the telomeric end with the 3′G-rich overhang. About 97% of replication origins used to replicate telomeres were reported to lie within the subtelomeric region. The radioactively (*) labelled, G-rich probe (thick grey line) can detect ssDNA on the C-strand arising from a stalled fork. The accumulation of ssDNA in shFANCM RNA cells (right panel) could be due to increased stalling of replication forks in the telomeric repeats.
Figure 3
Figure 3
FANCM's ability to slow down replication forks relies on its ATPase activity (A) HEK293 cells stably depleted for FANCM and complemented by either WT FANCM or the ATPase mutant (K117R) FANCM were pulse labelled for 15 min with BrdU and track length was analysed. Cells expressing the ATPase mutant displayed increased track length (median=2.3 μm, n=195) compared with control cells (median=1.4 μm, n=219). The P-value (<0.0001) is displayed above the graph. (B) Analysis of replication tracks after 60 min pulse labelling with BrdU: WT FANCM, median=18.5 μm, n=104; K117R FANCM, median=10.1 μm, n=138, P<0.0001. (C) DNA from WT FANCM and K117R FANCM cells was extracted under non-denaturing conditions, dot blotted, and ssDNA was revealed, as described in Figure 2. On the right, a histogram shows the result of the quantification of ssDNA levels in two independent experiments (# 1 and # 2). FANCM's ability to slow down replication forks is independent of FANCD2. (D) Two different oligonucleotides against the FANCD2 sequence were cloned in the pSUPER-puro plasmid (shD2#1 and 2) to deplete FANCD2 in HeLa cells. (E) shFANCD2 and control cells were pulse labelled 15 min with BrdU and track length of newly synthesized DNA was determined. The distribution of BrdU tracks in shFANCD2 cells was significantly (P<0.05) inferior compared with control cells. (F) Same experiment as in (E), but this time DNA was pulse labelled for 60 min. The median of the track length of FANCD2 shRNA cells is significantly shorter than the one of control cells (P<0.0001).
Figure 4
Figure 4
FANCM counteracts replication in the presence of aphidicolin. (A) HeLa cells were exposed to different concentrations of aphidicolin for 60 min in the presence of BrdU. DNA track length of >100 tracks was plotted on the y axis for each concentration of aphidicolin. The median of track length was 9% shorter for untreated shFANCM (shM#1) cells. This value was higher in the presence of aphidicolin and absence of FANCM (+48% for 0.1 μM, +23% for 0.2 μM aph). (B) Control and FANCM shRNA cells were exposed for 3 h to 4 μM aphidicolin. In FANCM-depleted cells, phosphorylation of Chk1 and monoubiquitination of FANCD2 is diminished. (C) HeLa cells depleted for FANCM survived better during chronic exposure to aphidicolin than control cells (mean and s.e.m. plotted).
Figure 5
Figure 5
FANCM promotes DNA chain elongation through CPT-damaged DNA. (A) The reduction in replication track length was greater in shFANCM than in control cells (−41% for 0.5 μM CPT, −33% for 1 μM and −44% for 2.5 μM). (B) DNA damage checkpoint signalling is defective in shFANCM cells. Cells were exposed to 2.5 μM CPT for up to 3 h. FANCM shRNA cells showed diminished phosphorylation of Chk1 and H2AX on western blots. (C) In the presence of CPT, the survival of FANCM shRNA cells is more severely impaired than the survival of control cells (mean and s.e.m. plotted).
Figure 6
Figure 6
FANCM promotes fork reactivation after CPT treatment. (A) Outline of the protocol used to quantify replication fork reactivation after treatment with replication-blocking agents. Cells were pulse labelled with CldU (red) during exposure to HU or CPT and released in the presence of IdU (green). Forks that terminate during the CldU pulse are red, ongoing forks are red and green. (B) Cells were labelled according to the protocol depicted in (A). The percentage of terminated forks was determined by counting red tracks and dividing them by the total number of forks (red and red–green tracks) and multiplied by 100. The mean and standard deviation of three independent experiments are represented in the graph (n>500). In the presence and absence of HU FANCM shRNA cells reactivated almost as many forks as wild-type cells. Whereas CPT prevented 26.8% of forks in control cells from resuming replication, this number reached 57.1% in cells depleted for FANCM. (C) HEK293 FANCM siRNA cells expressing either the ATPase mutant K117R or WT FANCM were labelled with CldU and IdU in the absence or presence of CPT as described in (A). Whereas in WT FANCM expressing cells 33.3% of the forks were not able to resume replication after CPT treatment, 55.6% of the forks terminated in the ATPase mutant K117R cells (average of three independent experiments, n>500 each).
Figure 7
Figure 7
FANCM and Chk1 stabilize each other after exposure to DNA-damaging agents. (A) HeLa cells depleted for FANCM phosphorylate Chk1 almost as robustly as control cells when exposed to drugs for 24 h (1 mM HU, 1 μM aphidicolin and 50 nM camptothecin). FANCM is destabilized after CPT treatment for 24 h (upper panel). Chk1 is destabilized in the presence of CPT, but more importantly in the absence of FANCM and presence of DNA-damaging agents (lower panel). (B) FANCM is degraded in the presence of the replication inhibitors aphidicolin (1 μM) and HU (1 mM) on addition of the Chk1 inhibitor UCN01 (0.3 μM, 24 h; lanes 3 and 5). (C) Less FANCM is present in HeLa cells exposed to 1 mM HU for 8 h in the presence of 1.5 μM Gö6976, a Chk1 inhibitor. (D) FANCM protein levels decrease in Chk1 shRNA HeLa cells in the presence of HU (1 mM, 8 h). Compare lanes 2 and 4. (E) FANCM shRNA HeLa cells survive less well in the presence of UCN01, whereas FANCD2 shRNA cells show an intermediate phenotype. (F) FANCM destabilization by 1 μM aphidicolin or 1 mM HU in the presence of 0.1 μM UCN01 can be reversed on inhibition of the proteasome by MG132 (25 μM, 16 h; lanes 6, 9 and 11).
Figure 8
Figure 8
(A) FANCM could prevent the accumulation of ssDNA by coupling leading and lagging strand synthesis. In wild-type cells, if leading strand synthesis is halted and lagging strand synthesis continues (left panel), long stretches of ssDNA are exposed. Chk1 (C) is activated at ssDNA and FANCM (M) is stabilized. FANCM could then regress the lagging strand by extruding ssDNA (bold arrow represents direction of fork reversal). FANCM continues fork reversal until the gap of ssDNA at the fork disappears. FANCM, or another branch point translocase (e.g. BLM), helps reversing the fork in the opposite direction (bold arrow), DNA chain elongation of the leading strand proceeds and the extruded ssDNA of the last synthesized Okazaki fragment is reannealed with the template strand. FANCM is not stabilized by Chk1 anymore and degraded by the proteasome and the newly coupled leading and lagging strand forks can resume replication. In FANCM shRNA cells, the occurrence of ssDNA could lead to unscheduled repriming events and thereby account for the longer replication tracks and the accumulation of ssDNA observed when FANCM is depleted. Alternatively, in the absence of FANCM, stalled forks may be subjected to nucleolytic cleavage and collapse. (B) Replication-blocking lesions (grey oval), for example, caused by CPT or UV, lead to the accumulation of positive supercoiling ahead of the replication fork. CPT brings about low levels of ssDNA and weak Chk1 activity. In wild-type cells, FANCM is stabilized locally and fork reversal by FANCM (bold arrow indicates direction) could relieve the topological strain and facilitate the access of repair proteins. FANCM, or another branch point translocase, would then regress the fork in the reverse direction (bold arrow), a new Okazaki fragment would be synthesized and the forks of the leading and lagging strand recoupled. In FANCM shRNA cells (right panel), the repriming of DNA replication is probably inhibited by the physical block and the positive supercoiling that occurs between the hindrance and the fork.

Comment in

  • FANCM: fork pause, rewind and play.
    Collis SJ, Boulton SJ. Collis SJ, et al. EMBO J. 2010 Feb 17;29(4):703-5. doi: 10.1038/emboj.2009.415. EMBO J. 2010. PMID: 20160754 Free PMC article.

Similar articles

Cited by

References

    1. Arabshahi L, Brown N, Khan N, Wright G (1988) Inhibition of DNA polymerase alpha by aphidicolin derivatives. Nucleic Acids Res 16: 5107–5113 - PMC - PubMed
    1. Auerbach AD, Wolman SR (1976) Susceptibility of Fanconi's anaemia fibroblasts to chromosome damage by carcinogens. Nature 261: 494–496 - PubMed
    1. Azzalin CM, Lingner J (2006) The human RNA surveillance factor UPF1 is required for S phase progression and genome stability. Curr Biol 16: 433–439 - PubMed
    1. Bain J, Plater L, Elliott M, Shpiro N, Hastie CJ, McLauchlan H, Klevernic I, Arthur JS, Alessi DR, Cohen P (2007) The selectivity of protein kinase inhibitors: a further update. Biochem J 408: 297–315 - PMC - PubMed
    1. Bakker ST, van de Vrugt HJ, Rooimans MA, Oostra AB, Steltenpool J, Delzenne-Goette E, van der Wal A, van der Valk M, Joenje H, te Riele H, de Winter JP (2009) Fancm-deficient mice reveal unique features of Fanconi anemia complementation group M. Hum Mol Genet 18: 3484–3495 - PubMed

Publication types

MeSH terms

LinkOut - more resources