. 2009 Dec 14;187(6):875-88.
doi: 10.1083/jcb.200908115.

Valosin-containing protein (VCP) is required for autophagy and is disrupted in VCP disease

Affiliations

Valosin-containing protein (VCP) is required for autophagy and is disrupted in VCP disease

Jeong-Sun Ju et al. J Cell Biol. .

Abstract

Mutations in valosin-containing protein (VCP) cause inclusion body myopathy (IBM), Paget's disease of the bone, and frontotemporal dementia (IBMPFD). Patient muscle has degenerating fibers, rimmed vacuoles (RVs), and sarcoplasmic inclusions containing ubiquitin and TDP-43 (TARDNA-binding protein 43). In this study, we find that IBMPFD muscle also accumulates autophagosome-associated proteins, Map1-LC3 (LC3), and p62/sequestosome, which localize to RVs. To test whether VCP participates in autophagy, we silenced VCP or expressed adenosine triphosphatase-inactive VCP. Under basal conditions, loss of VCP activity results in autophagosome accumulation. After autophagic induction, these autophagosomes fail to mature into autolysosomes and degrade LC3. Similarly, IBMPFD mutant VCP expression in cells and animals leads to the accumulation of nondegradative autophagosomes that coalesce at RVs and fail to degrade aggregated proteins. Interestingly, TDP-43 accumulates in the cytosol upon autophagic inhibition, similar to that seen after IBMPFD mutant expression. These data implicate VCP in autophagy and suggest that impaired autophagy explains the pathology seen in IBMPFD muscle, including TDP-43 accumulation.


Figures
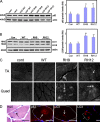
Figure 1.
Figure 1.
LC3 and p62 accumulate in IBMPFD muscle tissue. (A and B) Immunoblot of 9-mo-old quadriceps muscle lysates from control (cont) or VCP-WT, -RH9, or -RH12 mutant transgenic lines with p62 (A) or LC3 (B) antibodies. Note the increase in p62 and LC3II isoforms in mutant animals. Densitometric quantification is from more than six 9-mo-old animals/group. LC3 and p62 levels are normalized to loading control. Error bars represent the standard error from six independent experiments. **, P < 0.001. AU, arbitrary unit. (C) p62 immunostaining of tibialis anterior (TA) or quadriceps (Quad) muscle from 9-mo-old control, VCP-WT, or one of two VCP-RH transgenic lines (RH9 or RH12). Note accumulations of p62 in the middle of myofibers or along subsarcolemmal regions. (D) Histochemistry and immunohistochemistry of quadriceps muscle from VCP-RH–expressing transgenic mice. Hematoxylin and eosin (H&E) staining of a 15-mo-old animal with an RV, p62 immunostaining of an RV from a 12-mo-old animal, LC3 immunostaining of an RV, and subsarcolemmal accumulations of LC3 from a 12-mo-old animal. The bracket highlights one LC3-positive myofiber. A single muscle fiber is outlined in white. (C and D) Arrows denote vacuoles or accumulations of p62 or LC3. Bars, 30 µm.
Figure 2.
Figure 2.
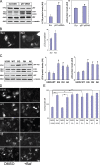
LC3 and p62 accumulate in VCP-KD and IBMPFD mutant–expressing cells. (A) Lysates from scrambled siRNA or VCP-targeted siRNA–treated U20S cells immunoblotted with antibodies to VCP, LC3, p62, or α-tubulin. Densitometric analysis is graphically represented from four independent experiments. LC3 and p62 levels are normalized to loading control. (B) Fluorescent microscopy images of siRNA scrambled control (Scr) or VCP-targeted siRNA KD cells expressing GFP-LC3. Basal numbers of GFP-LC3 puncta/cell were counted. (C) Lysates from control or myc-tagged VCP-WT, ATPase-inactive VCP-EQ, or one of two IBMPFD mutants, VCP-RH or -AE, expressed for 16 h from stably transfected tetracycline-inducible U20S cells and immunoblotted with antibodies to myc, LC3, p62, or α-tubulin. Densitometric analysis is graphically represented from four independent experiments. LC3 and p62 levels are normalized to loading control. Note the increase in LC3II and p62 in VCP siRNA KD and mutant-expressing cells. (D) Fluorescent microscopy images of tetracycline-inducible U20S cells expressing GFP-LC3 treated with and without Baf for 4 h (DMSO control [left] or Baf+ [right]). Cells are control U20S cells and VCP-WT, -RH, -AE, and -EQ. (E) The number of GFP-LC3 puncta/cell was counted for control U20S and VCP-WT, -EQ, -RH, and -AE with and without Baf for 4 h (DMSO or Baf). Note the increase in basal GFP-LC3 puncta in mutant-expressing cells. (A–C and E) Error bars represent the standard error from four independent experiments. *, P < 0.01; and **, P < 0.001. Bars, 25 µm.
Figure 3.
Figure 3.
Functional VCP is required for autophagosome maturation. (A) Epifluorescent images for GFP and mRFP in U20S or VCP-WT–, VCP-RH–, VCP-AE–, or VCP-EQ–expressing cells transfected with mRFP-GFP-LC3 (tfLC3) and treated with rapamycin for 2 h to induce autolysosome formation. (B) siRNA control (Scr) or VCP-KD– or Baf-treated control U20S cells transfected with tfLC3 and treated with rapamycin for 2 h to induce autolysosome formation. (A and B) Open arrows denote autophagosomes (both GFP and mRFP fluorescence), whereas closed arrows highlight autolysosomes (mRFP only fluorescence). (C) The graph represents Pearson's coefficient of GFP and mRFP colocalization from 10 independent fields of cells in two different experiments. Error bars represent the standard error from 20 fields in two independent experiments. *, P < 0.001. (D) Lysates from U20S or tetracycline-inducible VCP-WT, -RH, or -AE cells treated with vehicle or Baf for 4 h and immunoblotted for LC3 and α-tubulin. Note that Baf treatment does not increase the LC3II levels in IBMPFD mutant (RH and AE)–expressing cells. Bars, 15 µm.
Figure 4.
Figure 4.
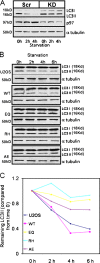
Functional VCP is required for autophagic protein degradation. (A) Lysates from siRNA-treated U20S cells (scramble control [Scr] or VCP siRNA KD) after autophagic induction via nutrient deprivation for 0, 2, or 4 h and immunoblotting for LC3 and α-tubulin. LC3II degrades over time in control but not in KD cells. One of two experiments is shown. (B) Lysates from U20S or tetracycline-inducible VCP-WT, -EQ, -RH, or -AE cells after autophagic induction via nutrient deprivation for 0, 2, 4, or 6 h and immunoblotting for LC3 and α-tubulin. LC3II degrades in control and VCP-WT but degrades less efficiently in mutant (EQ, RH, or AE)-expressing cells. (C) Graphical representation of densitometric evaluation of LC3II and α-tubulin at each time point from three independent experiments.
Figure 5.
Figure 5.
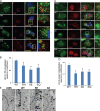
Autophagosomes have decreased localization with lysosomal markers in IBMPFD mutant–expressing cells. (A) Epifluorescent images for GFP-LC3 (LC3) and LTR of VCP-WT–, VCP-RH–, VCP-AE–, or VCP-EQ–expressing cells transfected with GFP-LC3 and treated with rapamycin for 2 h to induce autolysosome formation. Open arrows highlight autolysosomes (GFP and LTR colocalized), and closed arrows show autophagosomes (GFP only). (B) Pearson's coefficient of GFP and LTR colocalization from 10 independent fields of cells in two different experiments. (C) Epifluorescent images for GFP-LC3 and endogenous Lamp1 immunohistochemistry of U20S, VCP-WT–, VCP-RH–, VCP-AE–, or VCP-EQ–expressing cells or U20S cells cotreated with Baf transfected with GFP-LC3 and treated with rapamycin for 2 h to induce autolysosome formation. Arrows highlight autolysosomes (GFP and Lamp1 colocalized). (A and C) The boxed regions in the merge field are enlarged in the adjacent panels. (D) Pearson's coefficient of GFP and Lamp1 colocalization from 10 independent fields of cells in two different experiments. (B and D) Error bars represent the standard error from 20 fields in two independent experiments. *, P < 0.001. (E) Electron microscopy of tetracycline-inducible control or VCP-WT–, VCP-RH–, or VCP-AE–expressing U20S cells induced for 16 h and then treated with rapamycin for 2 h. Note the accumulation of autophagic structures in the mutant-expressing cell lines. Arrows denote autophagic structures. Bars: (A and C) 15 µm; (E) 1 µm.
Figure 6.
Figure 6.
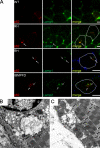
Autophagic and lysosomal markers localize to RVs in IBMPFD tissue. (A) Immunofluorescence images of quadriceps muscle using p62 and Lamp1 or -2 antibodies. Quadriceps section from a 9-mo-old VCP-WT mouse, age-matched VCP-RH transgenic, 12-mo-old VCP-RH transgenic, and IBMPFD patient muscle biopsy are shown. Open arrows highlight p62 and Lamp1/2 colocalization, and closed arrows show regions of only p62 immunofluorescence. Single myofibers containing RVs are outlined in the merge panels. (B and C) Transmission electron microscopy of tibialis anterior muscle from one of two independent lines (B shows RH12, and C shows RH9 lines) of 12-mo-old VCP-RH–expressing transgenic mice. Note the large vacuolated structures that are perinuclear or subsarcolemmal. Bars: (A) 30 µm; (B and C) 500 nm.
Figure 7.
Figure 7.
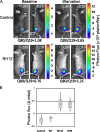
Impaired autophagic substrate degradation in IBMPFD mouse muscle. (A) Representative images using in vivo bioluminescence of control or IBMPFD mutant RH–expressing mice (RH12) 2 d after electroporation (baseline) or after 24 h of nutrient deprivation (starvation) of polyQ80 (Q80)- or polyQ19-luciferase (Q19) in the right and left tibialis anterior, respectively. The ratio of polyQ80-luciferase/polyQ19-luciferase is indicated below each image set. Values are in ×104 photons per second per square centimeter per steradian. (B) Box and whisker plot of the change (Δ) in the ratio of polyQ80-luciferase/polyQ19-luciferase activity in the left and right tibialis anterior muscle of control, VCP-WT, or one of two VCP-RH (RH12 or RH9) transgenic mouse lines after 24 h of starvation. The graph is representative of three animals per group. The p-value for RH12 was 0.05 and 0.06 when compared with control animals or VCP-WT transgenic. The p-value for RH9 was 0.03 when compared with either control or VCP-WT transgenic. The p-value was 0.01 and 0.02 when combined RH12 and RH9 animals were compared with control or VCP-WT groups, respectively. There was no statistical difference between control or VCP-WT groups.
Figure 8.
Figure 8.
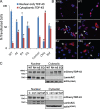
IBMPFD mutant expression or autophagic inhibition redistributes TDP-43 to the cytosol in cells. (A) Quantitation of mCherry–TDP-43 distribution (nuclear only or cytoplasmic) in control U20S, VCP-WT–, VCP-RH–, VCP-AE–, or VCP-EQ–expressing cells, or control U20S cells treated with 10 µM Baf or 50 µM chloroquine (Chlq) for 4 h from 10 different fields from two independent experiments. Error bars represent the standard error from 20 fields in two independent experiments. *, P < 0.02 when compared with VCP-WT–expressing cells. (B) Epifluorescent images for mCherry–TDP-43 (red) and DAPI (blue) in control U20S, VCP-WT–, VCP-RH–, or VCP-AE–expressing cells, or control U20S cells treated with Baf or chloroquine for 4 h. Arrows denote cytosolic TDP-43 and perinuclear TDP-43 inclusions. (C, top) Immunoblot for TDP-43, lamin A/C, and actin from nuclear or cytosolic lysate fractions of mCherry–TDP-43–transfected VCP-WT–, VCP-RH–, VCP-AE–, or VCP-EQ–expressing cells. Note the increase in cytosolic TDP-43 from IBMPFD mutant– and EQ-expressing cells. (bottom) Immunoblot for TDP-43, lamin A/C, and actin from nuclear or cytosolic lysate fractions of untreated U20S cells transfected with mCherry–TDP-43 or similarly transfected cells treated with 30 µg/ml (cq1) or 120 µg/ml (cq2) chloroquine diphosphate or 200 ng/ml Baf. Data are representative of three independent experiments. Bar, 15 µm.
Figure 9.
Figure 9.
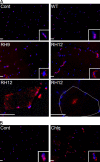
IBMPFD mutant expression or autophagic inhibition redistributes TDP-43 to the cytosol in mouse skeletal muscle. (A) TDP-43 immunostaining of quadriceps skeletal muscle from 15-mo-old control (Cont) or VCP-WT, -RH9, or -RH12 transgenic mice. A single myofiber is outlined in white. (B) TDP-43 immunostaining of quadriceps skeletal muscle from 3-mo-old mice treated with saline or 50 mg/kg/d intraperitoneal chloroquine (Chlq) for 4 wk. (A and B) Insets show one myonuclei from each field. Bars, 30 µm.

Similar articles

Cited by

References

    1. Caccamo A., Majumder S., Deng J.J., Bai Y., Thornton F.B., Oddo S. 2009. Rapamycin rescues TDP-43 mislocalization and the associated low molecular mass neurofilament instability. J. Biol. Chem. 284:27416–27424 10.1074/jbc.M109.031278 - DOI - PMC - PubMed
    1. Dalal S., Rosser M.F., Cyr D.M., Hanson P.I. 2004. Distinct roles for the AAA ATPases NSF and p97 in the secretory pathway. Mol. Biol. Cell. 15:637–648 10.1091/mbc.E03-02-0097 - DOI - PMC - PubMed
    1. Fernandez C., Figarella-Branger D., Meyronet D., Cassote E., Tong S., Pellissier J.F. 2005. Electron microscopy in neuromuscular disorders. Ultrastruct. Pathol. 29:437–450 10.1080/01913120500323175 - DOI - PubMed
    1. Filimonenko M., Stuffers S., Raiborg C., Yamamoto A., Malerød L., Fisher E.M., Isaacs A., Brech A., Stenmark H., Simonsen A. 2007. Functional multivesicular bodies are required for autophagic clearance of protein aggregates associated with neurodegenerative disease. J. Cell Biol. 179:485–500 10.1083/jcb.200702115 - DOI - PMC - PubMed
    1. Forman M.S., Mackenzie I.R., Cairns N.J., Swanson E., Boyer P.J., Drachman D.A., Jhaveri B.S., Karlawish J.H., Pestronk A., Smith T.W., et al. 2006. Novel ubiquitin neuropathology in frontotemporal dementia with valosin-containing protein gene mutations. J. Neuropathol. Exp. Neurol. 65:571–581 10.1097/00005072-200606000-00005 - DOI - PubMed

Publication types

MeSH terms