. 2010 Feb 26;285(9):6636-47.
doi: 10.1074/jbc.M109.081539. Epub 2009 Dec 12.

Molecular details of Bax activation, oligomerization, and membrane insertion

Affiliations

Molecular details of Bax activation, oligomerization, and membrane insertion

Stephanie Bleicken et al. J Biol Chem. .

Abstract

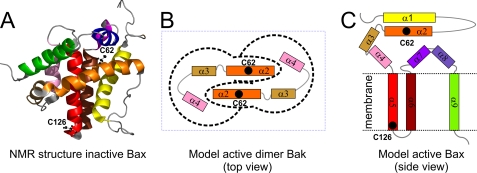
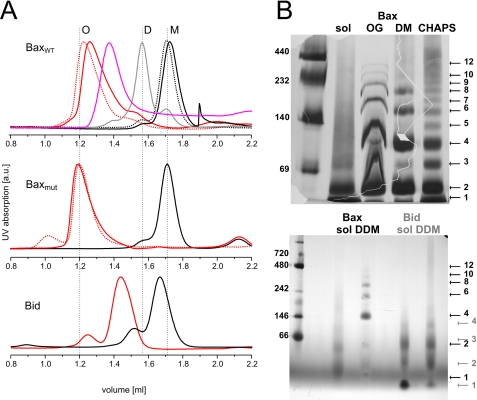
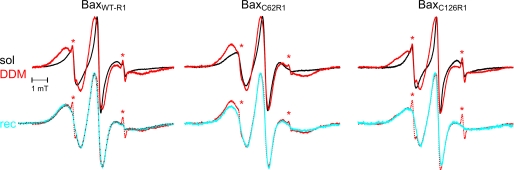
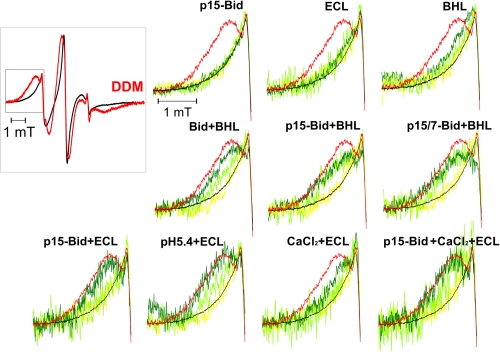
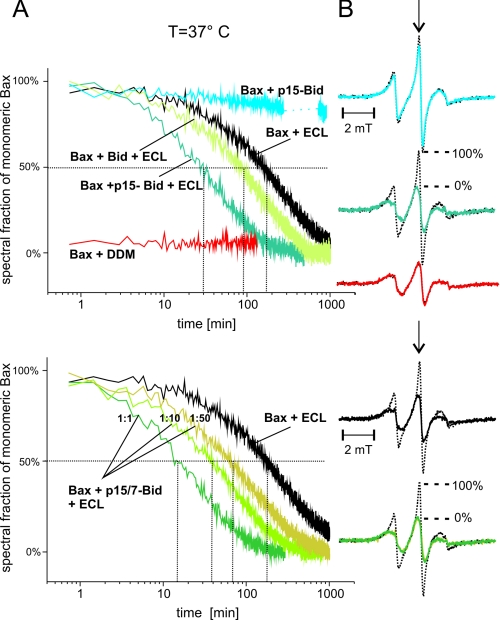
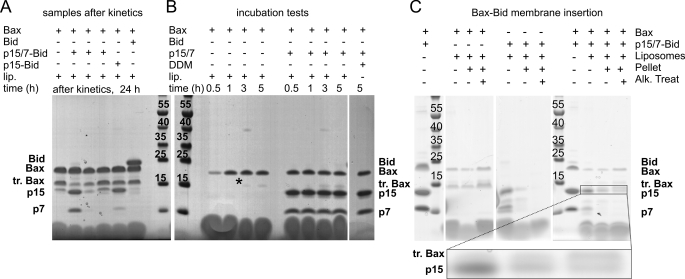
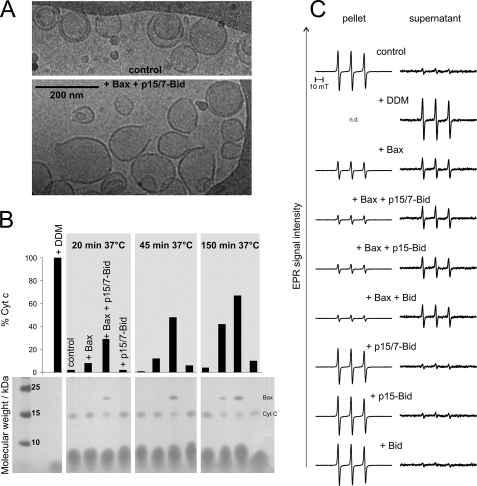
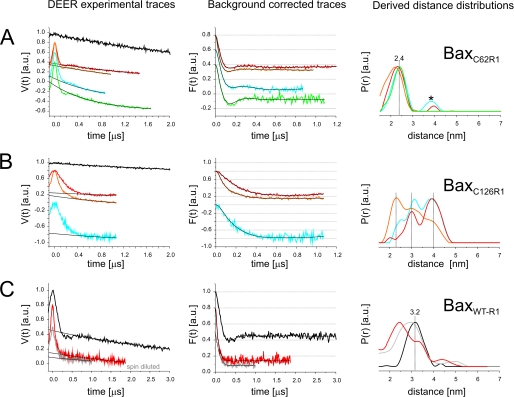
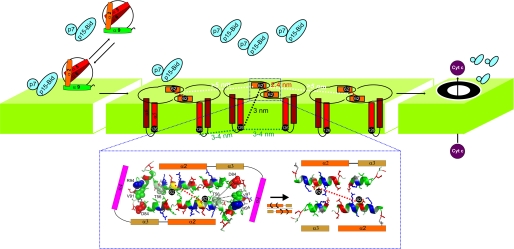
Bax and Bid are pro-apoptotic members of the Bcl-2 protein family. Upon cleavage by caspase-8, Bid activates Bax. Activated Bax inserts into the mitochondrial outer membrane forming oligomers which lead to membrane poration, release of cytochrome c, and apoptosis. The detailed mechanism of Bax activation and the topology and composition of the oligomers are still under debate. Here molecular details of Bax activation and oligomerization were obtained by application of several biophysical techniques, including atomic force microscopy, cryoelectron microscopy, and particularly electron paramagnetic resonance (EPR) spectroscopy performed on spin-labeled Bax. Incubation with detergents, reconstitution, and Bid-triggered insertion into liposomes were found to be effective in inducing Bax oligomerization. Bid was shown to activate Bax independently of the stoichiometric ratio, suggesting that Bid has a catalytic function and that the interaction with Bax is transient. The formation of a stable dimerization interface involving two Bcl-2 homology 3 (BH3) domains was found to be the nucleation event for Bax homo-oligomerization. Based on intermolecular distance determined by EPR, a model of six adjacent Bax molecules in the oligomer is presented where the hydrophobic hairpins (helices alpha5 and alpha6) are equally spaced in the membrane and the two BH3 domains are in close vicinity in the dimer interface, separated by >5 nm from the next BH3 pairs.


Figures

FIGURE 1.
FIGURE 1.
Monomeric Bax and putative models for the activated state. A, ribbon diagram of the NMR structure of Bax in the inactive monomeric form (Protein Data Bank code 1F16 (14)). The color code is shown in C. The two native cysteines (Cys-62 and Cys-126) are represented as ball-and-stick models (Cβ–Cβ average distance, 2.6 nm). B, sketch of the Bak dimer interface with the elongated helix α2/α3 obtained by cross-linking data (23). C, putative model of Bax inserted in the membrane obtained from cysteine scanning analysis (21).
FIGURE 2.
FIGURE 2.
Oligomerization assays. A, top panel, size exclusion chromatography on BaxWT and BaxWT-R1 (dotted and straight lines, respectively) in the soluble (black) and DDM-induced oligomeric (red) forms. Monomeric BaxWT after prolonged storage (gray) and oligomeric BaxWT after detergent removal (pink) are also shown. The elution volumes for the monomeric (M), dimeric (D), and oligomeric (O) states are highlighted by vertical dotted lines. Under the experimental conditions used, standard soluble proteins of 20 and 440 kDa are eluting at 1.7 and 1.15 ml, respectively. Middle panel, monomeric BaxC62R1 (black) and DDM-induced oligomeric BaxC62R1 and BaxC126R1 (straight and dashed red lines, respectively). Bottom panel, full-length Bid in aqueous buffer (black) and in the presence of DDM (red). B, upper panel, blue native gel electrophoresis of soluble (sol) and detergent-preincubated Bax samples (OG, octyl glucoside; DM, n-decyl β-d-maltoside). In the left lane, marker proteins of different sizes are shown. On the right, the putative number of monomers in the oligomers is shown. Lower panel, comparison between Bax and Bid in the soluble and DDM-incubated forms.
FIGURE 3.
FIGURE 3.
Room temperature continuous wave normalized EPR spectra of BaxWT-R1, BaxC62R1, and BaxC126R1. Upper panel, spectra of monomeric water-soluble (sol) Bax (black) superimposed over DDM-activated Bax (DDM). The asterisks denote a small fraction of unwashed free label in the DDM samples. Lower panel, spectra of Bax reconstituted (rec) in liposomes from E. coli polar lipids (blue). For comparison the spectra in DDM are superimposed as dotted red lines. For BaxWT-R1 the spectrum of the oligomeric form reconstituted in liposomes formed by bovine heart lipids is also superimposed in gray.
FIGURE 4.
FIGURE 4.
Effect of different triggering agents on Bax conformation at room temperature (20 °C). The inset shows two superimposed normalized spectra of BaxWT-R1 in water (black) and in DDM (red). The low field region of the spectra is enclosed by a square. The changes in the low field region of the spectra of BaxWT-R1 incubated for 4 min (yellow), 150 min (light green), and 16 h (dark green) in the presence of different triggering agents are presented superimposed on the spectra of Bax in the soluble (black) and DDM (red) forms. The triggering agents added to Bax are indicated. Liposomes were formed with ECL and bovine heart lipids (BHL).
FIGURE 5.
FIGURE 5.
Kinetics of Bax conformational changes at 37 °C. Spectra of BaxWT-R1 were recorded each 43 s at 37 °C with different triggering agents. A, the intensity of the central EPR line versus incubation time (logarithmic scale) is plotted. Upper panel, effect of p15-Bid in water buffer, DDM, ECL liposomes alone, ECL liposomes and p15-Bid, and ECL liposomes and full-length Bid. Lower panel, effect of ECL liposomes and p15/7-Bid at different Bid-to-Bax stoichiometric ratios. The vertical lines highlight the half-times of the spectral changes from the 100 to 0% monomeric species. B, the EPR spectra detected at time zero (100% monomeric Bax, dotted gray lines) and at the end of the incubation time (0% monomeric Bax, colored).
FIGURE 6.
FIGURE 6.
SDS-PAGE of Bax-Bid-ECL liposomes mixtures. A, SDS-PAGE of the samples from the kinetic experiments shown in Fig. 5A after a 24-h incubation at 37 °C. lip., liposomes. B, tests on Bax-Bid-ECL liposomes mixtures or Bax-Bid mixtures upon increasing incubation times at 37 °C. An asterisk marks the conditions used for Bax activation in the EPR experiments, with negligible amount of truncated (tr.) Bax. C, SDS-PAGE of Bax-Bid-ECL liposomes mixtures before and after ultracentrifugation (only pellet fractions loaded) with or without alkali (Alk.) treatment. The enlarged gel part (inset) should allow a visual separation of the p15-Bid and the Bax fragment.
FIGURE 7.
FIGURE 7.
Pore formation assays. A, cryo-EM images. Upper panel, nontreated ECL liposomes were perfectly round and had smooth and continuous membranes. Lower panel, after a 2-h incubation with p15/7-Bid and BaxC62R1, the ECL liposomes exhibited regions of irregularity and pore-like structures with ∼50 nm diameters. B, cytochrome c release from liposomes. Upper panel, percentage of cytochrome c found in the supernatant. Lower panel, SDS-PAGE performed on the pellet. Standard molecular masses are depicted on the left. C, 4-phosphonooxy-TEMPO release from liposomes. Continuous wave EPR spectra are detected in the pellet (left) and in the supernatant (right). The highest signal intensity is expected in the pellet if liposomes are sealed and in the supernatant if they are open. Two control experiments in the absence of proteins and in the presence of DDM showed the expected behavior.
FIGURE 8.
FIGURE 8.
Interspin distance analysis. DEER analysis was performed on BaxC62R1 (A), BaxC126R1 (B), and BaxWTR1 (C). Left column, experimental intensity-normalized DEER time traces V(t) and exponentially decaying background signals arising from a three-dimensional distribution of remote spins (thin black lines) obtained with DeerAnalysis 2008 (31). Black, monomeric spin-labeled Bax; red, incubated with1% DDM; blue, liposome-reconstituted. The green trace was recorded for the pellet of liposomes incubated with BaxC62R1 and p15/7-Bid for 3 h. The brown traces are recorded at a low DDM (0.1%) to protein ratio and the gray traces at a high DDM to protein ratio on the sample containing 25% of the spin-labeled BaxWT-R1. The traces have been vertically displaced for clarity. Middle column, background-corrected experimental data F(t) fit by Tikhonov regularization with an α parameter 100 (thin black lines). Right column, distance distribution P(r) obtained by the fit. The asterisk denotes a possible artifact peak related to background subtraction and noise. a.u., arbitrary units.
FIGURE 9.
FIGURE 9.
Model of adjacent Bax dimers. The joint action of p15/7-Bid, the membrane bilayer, and Bax is shown as the triggering event for Bax dimerization and subsequent oligomerization. Three neighboring Bax dimers are inserted in the membrane bilayer according to the measured EPR distance constraints. Helices α2, α5, and α6 are shown as orange, red, and brown cylinders, whereas the other six helices are not represented. A small fraction of the p15/7-Bid moieties are shown bound to the membrane according to the SDS-PAGE data. Upon oligomerization a pore is formed that can release cytochrome c. Inset, schematic representation of the interaction interface between two neighboring Bax monomers. The molecules were created with the program COOT (56) and visualized with PyMOL (58). Two modified Bax moieties were rotated and translated to build up an interaction area in line with the cross-linked sites of Bak (23) and the 62-62′ EPR distance constraints of Bax (∼2.2 nm in the model). On the right, the elongated helices α2/α3 were rotated to create the proposed salt bridge interactions. Color coding of the amino acids is according to the hydropathic index by Kyte and Doolittle (57). Acidic (Glu and Asp) and basic (Lys and Arg) amino acids are shown in red and blue, respectively. Hydrophobic amino acids (Ile, Val, Leu, Ala, Cys, Phe, and Met) are shown in green and slightly hydrophobic residues (Gly, Thr, Ser, and Trp) in light green. The cysteine at position 62 is yellow.

Similar articles

Cited by

References

    1. Cory S., Adams J. M. (2002) Nat. Rev. Cancer 2, 647–656 - PubMed
    1. Kuwana T., Newmeyer D. D. (2003) Curr. Opin. Cell Biol. 15, 691–699 - PubMed
    1. Li H., Zhu H., Xu C. J., Yuan J. (1998) Cell 94, 491–501 - PubMed
    1. Chipuk J. E., Bouchier-Hayes L., Green D. R. (2006) Cell Death Differ. 13, 1396–1402 - PubMed
    1. Kuwana T., Bouchier-Hayes L., Chipuk J. E., Bonzon C., Sullivan B. A., Green D. R., Newmeyer D. D. (2005) Mol. Cell 17, 525–535 - PubMed

Publication types

MeSH terms

Substances