

Malaria paediatric hospitalization between 1999 and 2008 across Kenya
- PMID: 20003178
- PMCID: PMC2802588
- DOI: 10.1186/1741-7015-7-75
Malaria paediatric hospitalization between 1999 and 2008 across Kenya
Abstract
Background: Intervention coverage and funding for the control of malaria in Africa has increased in recent years, however, there are few descriptions of changing disease burden and the few reports available are from isolated, single site observations or are of reports at country-level. Here we present a nationwide assessment of changes over 10 years in paediatric malaria hospitalization across Kenya.
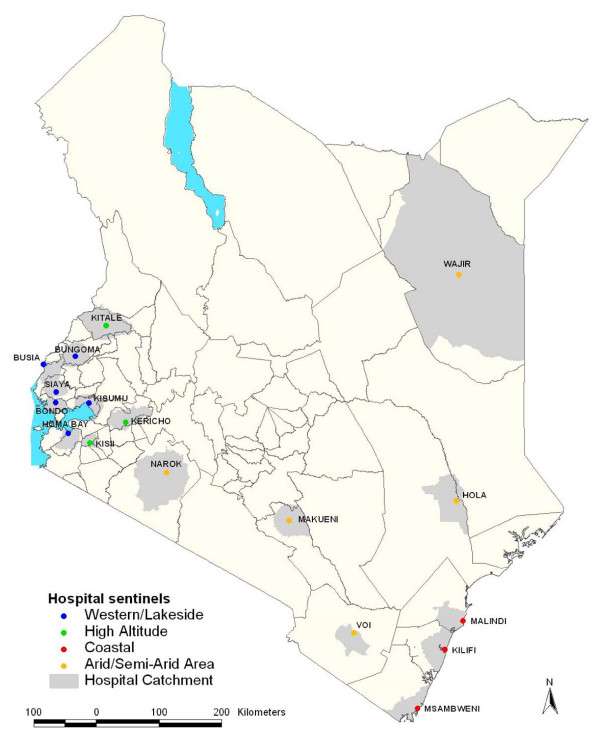
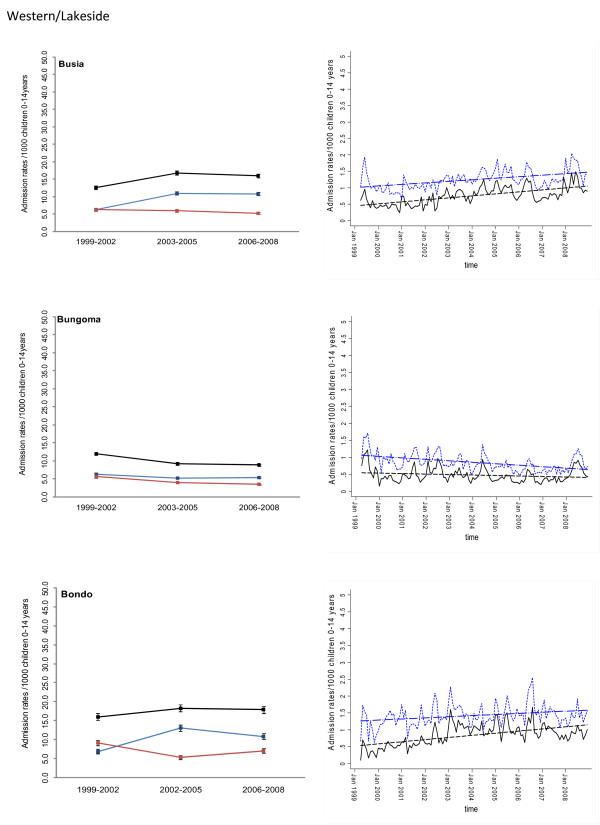
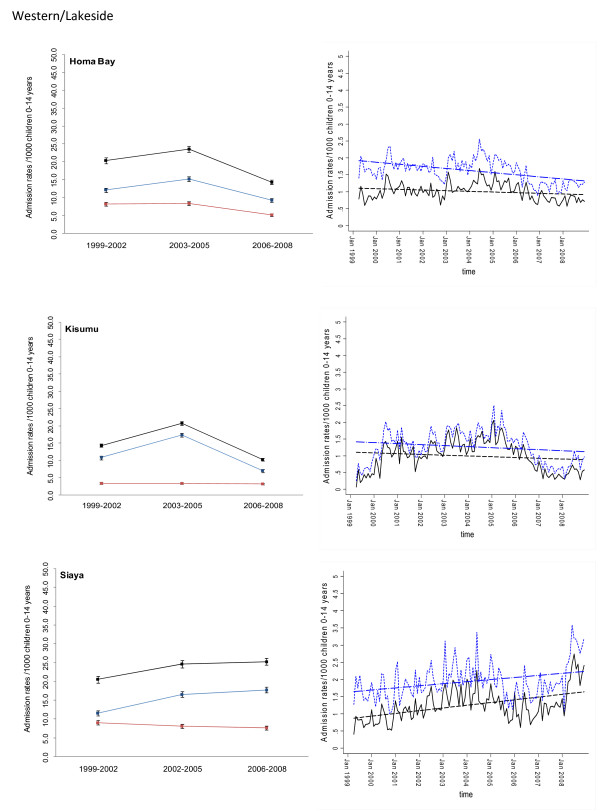
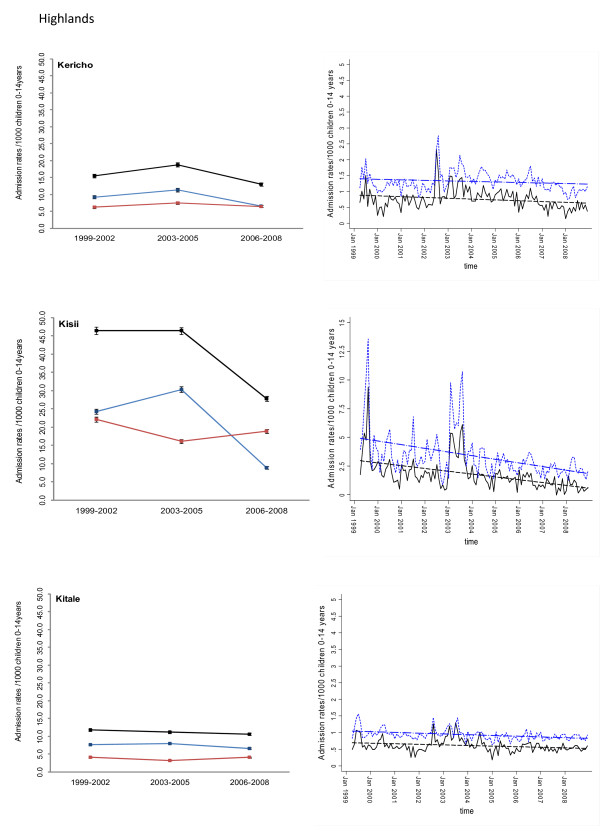
Methods: Paediatric admission data on malaria and non-malaria diagnoses were assembled for the period 1999 to 2008 from in-patient registers at 17 district hospitals in Kenya and represented the diverse malaria ecology of the country. These data were then analysed using autoregressive moving average time series models with malaria and all-cause admissions as the main outcomes adjusted for rainfall, changes in service use and populations-at-risk within each hospital's catchment to establish whether there has been a statistically significant decline in paediatric malaria hospitalization during the observation period.
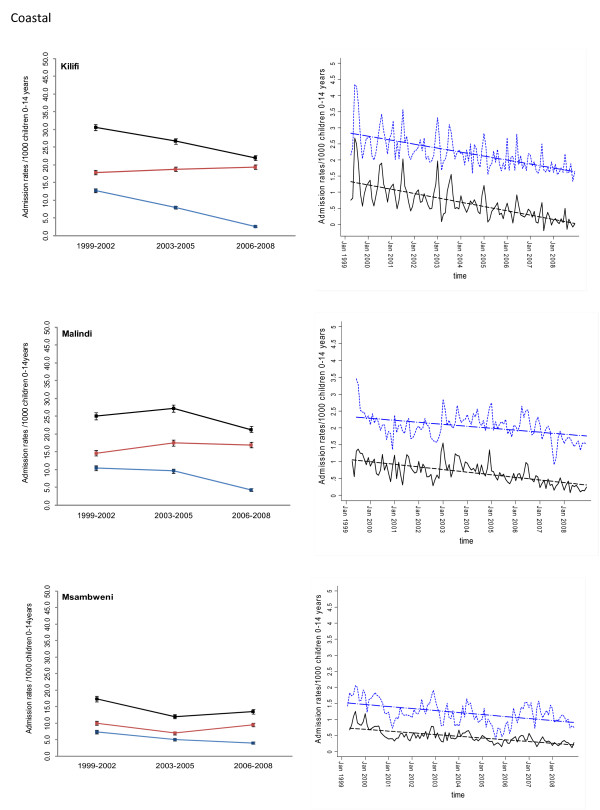
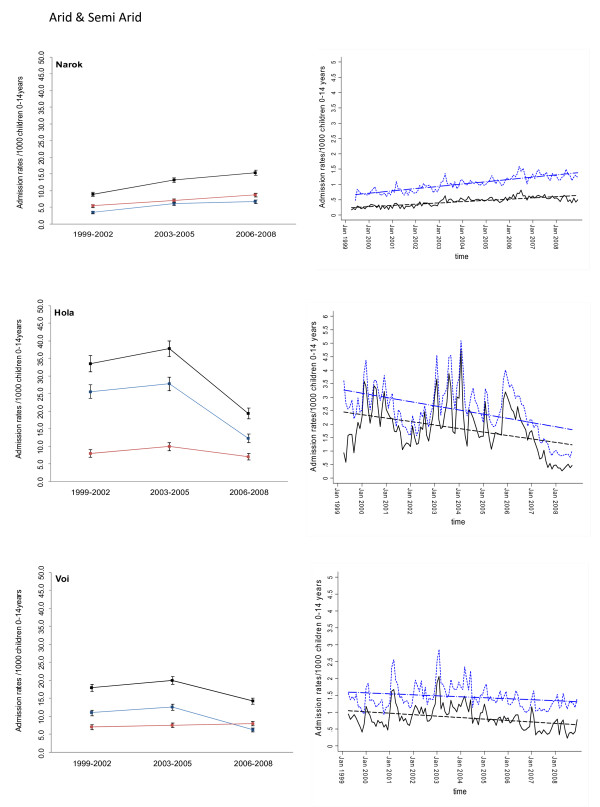
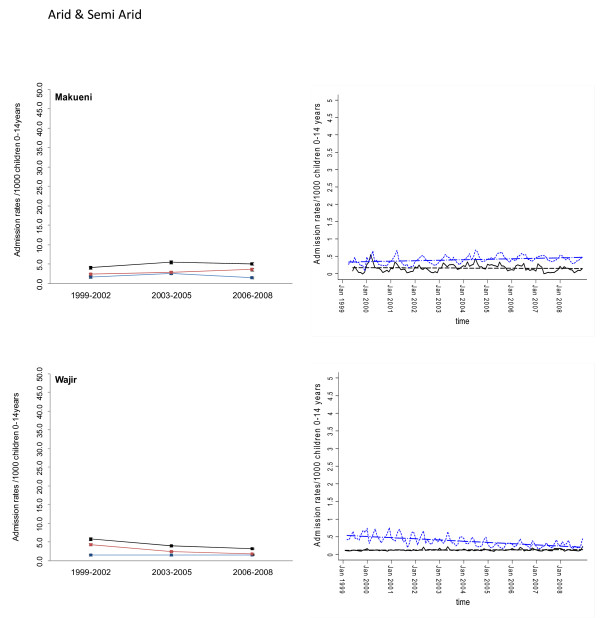
Results: Among the 17 hospital sites, adjusted paediatric malaria admissions had significantly declined at 10 hospitals over 10 years since 1999; had significantly increased at four hospitals, and remained unchanged in three hospitals. The overall estimated average reduction in malaria admission rates was 0.0063 cases per 1,000 children aged 0 to 14 years per month representing an average percentage reduction of 49% across the 10 hospitals registering a significant decline by the end of 2008. Paediatric admissions for all-causes had declined significantly with a reduction in admission rates of greater than 0.0050 cases per 1,000 children aged 0 to 14 years per month at 6 of 17 hospitals. Where malaria admissions had increased three of the four sites were located in Western Kenya close to Lake Victoria. Conversely there was an indication that areas with the largest declines in malaria admission rates were areas located along the Kenyan coast and some sites in the highlands of Kenya.
Conclusion: A country-wide assessment of trends in malaria hospitalizations indicates that all is not equal, important variations exist in the temporal pattern of malaria admissions between sites and these differences require more detailed investigation to understand what is required to promote a clinical transition across Africa.
Figures
Similar articles
-
Changing malaria intervention coverage, transmission and hospitalization in Kenya.Malar J. 2010 Oct 15;9:285. doi: 10.1186/1475-2875-9-285. Malar J. 2010. PMID: 20946689 Free PMC article.
-
The decline in paediatric malaria admissions on the coast of Kenya.Malar J. 2007 Nov 15;6:151. doi: 10.1186/1475-2875-6-151. Malar J. 2007. PMID: 18005422 Free PMC article.
-
Analysis of hospital records in four African countries, 1975-1990, with emphasis on infectious diseases.J Trop Med Hyg. 1995 Aug;98(4):217-27. J Trop Med Hyg. 1995. PMID: 7636917
-
Age patterns of severe paediatric malaria and their relationship to Plasmodium falciparum transmission intensity.Malar J. 2009 Jan 7;8:4. doi: 10.1186/1475-2875-8-4. Malar J. 2009. PMID: 19128453 Free PMC article. Review.
-
The clinical burden of malaria in Nairobi: a historical review and contemporary audit.Malar J. 2011 May 20;10:138. doi: 10.1186/1475-2875-10-138. Malar J. 2011. PMID: 21599931 Free PMC article. Review.
Cited by
-
Childhood malaria admission rates to four hospitals in Malawi between 2000 and 2010.PLoS One. 2013 Apr 26;8(4):e62214. doi: 10.1371/journal.pone.0062214. Print 2013. PLoS One. 2013. PMID: 23638008 Free PMC article.
-
Lipoic acid metabolism of Plasmodium--a suitable drug target.Curr Pharm Des. 2012;18(24):3480-9. doi: 10.2174/138161212801327266. Curr Pharm Des. 2012. PMID: 22607141 Free PMC article. Review.
-
Changing malaria intervention coverage, transmission and hospitalization in Kenya.Malar J. 2010 Oct 15;9:285. doi: 10.1186/1475-2875-9-285. Malar J. 2010. PMID: 20946689 Free PMC article.
-
Insecticide-Treated Net Campaign and Malaria Transmission in Western Kenya: 2003-2015.Front Public Health. 2016 Aug 15;4:153. doi: 10.3389/fpubh.2016.00153. eCollection 2016. Front Public Health. 2016. PMID: 27574601 Free PMC article.
-
What Is Threatening the Effectiveness of Insecticide-Treated Bednets? A Case-Control Study of Environmental, Behavioral, and Physical Factors Associated with Prevention Failure.PLoS One. 2015 Jul 14;10(7):e0132778. doi: 10.1371/journal.pone.0132778. eCollection 2015. PLoS One. 2015. PMID: 26171962 Free PMC article.
References
-
- RBM. The Global Malaria Action Plan For a Free Malaria world. Geneva: Roll Back Malaria Partnership, World Health Organization; 2008.
-
- Barat LM. Four malaria success stories: how malaria burden was successfully reduced in Brazil, Eritrea, India, and Vietnam. Am J Trop Med Hyg. 2006;74(1):12–16. - PubMed
-
- Barnes KI, Durrheim DN, Little F, Jackson A, Mehta U, Allen E, Dlamini SS, Tsoka J, Bredenkamp B, Mthembu DJ, White NJ, Sharp BL. Effect of artemether-lumefantrine policy and improved vector control on malaria burden in KwaZulu-Natal, South Africa. PLoS Med. 2005;2(11):e330. doi: 10.1371/journal.pmed.0020330. - DOI - PMC - PubMed
-
- Bhattarai A, Ali AS, Kachur SP, Martensson A, Abbas AK, Khatib R, Al-Mafazy AW, Ramsan M, Rotllant G, Gerstenmaier JF, Molteni F, Abdulla S, Montgomery SM, Kaneko A, Bjorkman A. Impact of artemisinin-based combination therapy and insecticide-treated nets on malaria burden in Zanzibar. PLoS Med. 2007;4(11):e309. doi: 10.1371/journal.pmed.0040309. - DOI - PMC - PubMed
Publication types
MeSH terms
Grants and funding
LinkOut - more resources
Full Text Sources
Medical
