

SIRT1 inhibits inflammatory pathways in macrophages and modulates insulin sensitivity
- PMID: 19996381
- PMCID: PMC2838524
- DOI: 10.1152/ajpendo.00417.2009
SIRT1 inhibits inflammatory pathways in macrophages and modulates insulin sensitivity
Abstract
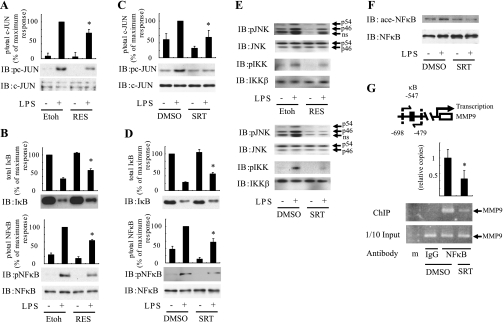
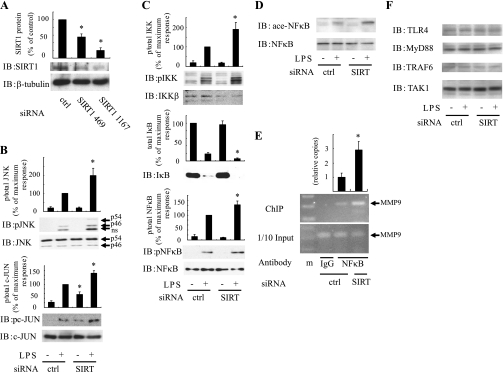
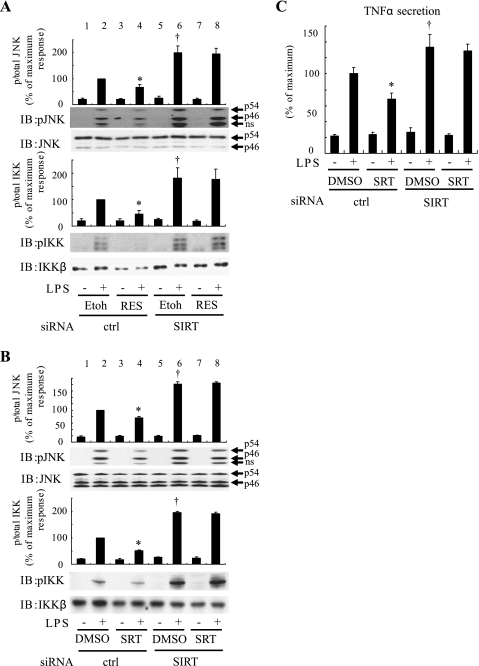
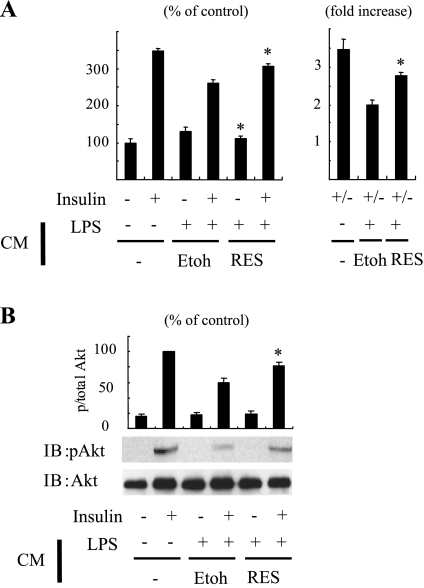
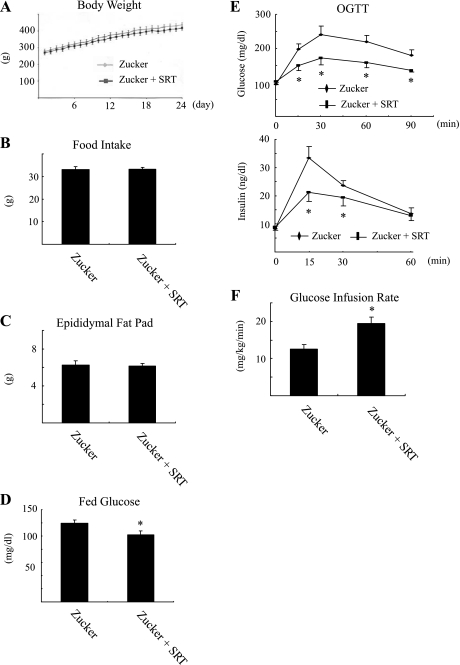
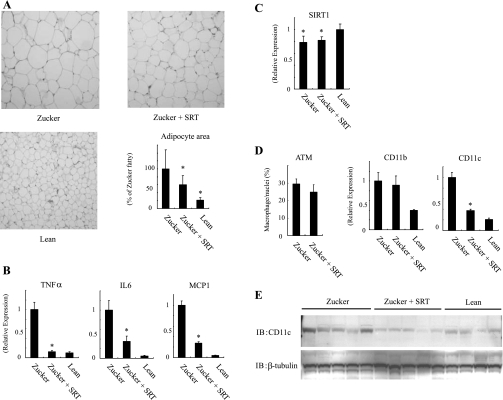
Chronic inflammation is an important etiology underlying obesity-related disorders such as insulin resistance and type 2 diabetes, and recent findings indicate that the macrophage can be the initiating cell type responsible for this chronic inflammatory state. The mammalian silent information regulator 2 homolog SIRT1 modulates several physiological processes important for life span, and a potential role of SIRT1 in the regulation of insulin sensitivity has been shown. However, with respect to inflammation, the role of SIRT1 in regulating the proinflammatory pathway within macrophages is poorly understood. Here, we show that knockdown of SIRT1 in the mouse macrophage RAW264.7 cell line and in intraperitoneal macrophages broadly activates the JNK and IKK inflammatory pathways and increases LPS-stimulated TNFalpha secretion. Moreover, gene expression profiles reveal that SIRT1 knockdown leads to an increase in inflammatory gene expression. We also demonstrate that SIRT1 activators inhibit LPS-stimulated inflammatory pathways, as well as secretion of TNFalpha, in a SIRT1-dependent manner in RAW264.7 cells and in primary intraperitoneal macrophages. Treatment of Zucker fatty rats with a SIRT1 activator leads to greatly improved glucose tolerance, reduced hyperinsulinemia, and enhanced systemic insulin sensitivity during glucose clamp studies. These in vivo insulin-sensitizing effects were accompanied by a reduction in tissue inflammation markers and a decrease in the adipose tissue macrophage proinflammatory state, fully consistent with the in vitro effects of SIRT1 in macrophages. In conclusion, these results define a novel role for SIRT1 as an important regulator of macrophage inflammatory responses in the context of insulin resistance and raise the possibility that targeting of SIRT1 might be a useful strategy for treating the inflammatory component of metabolic diseases.
Figures
Similar articles
-
Adipocyte SIRT1 controls systemic insulin sensitivity by modulating macrophages in adipose tissue.EMBO Rep. 2017 Apr;18(4):645-657. doi: 10.15252/embr.201643184. Epub 2017 Mar 7. EMBO Rep. 2017. PMID: 28270525 Free PMC article.
-
Myeloid SIRT1 regulates macrophage infiltration and insulin sensitivity in mice fed a high-fat diet.J Endocrinol. 2015 Feb;224(2):109-18. doi: 10.1530/JOE-14-0527. Epub 2014 Oct 27. J Endocrinol. 2015. PMID: 25349250
-
Moderate SIRT1 overexpression protects against brown adipose tissue inflammation.Mol Metab. 2020 Dec;42:101097. doi: 10.1016/j.molmet.2020.101097. Epub 2020 Oct 10. Mol Metab. 2020. PMID: 33049408 Free PMC article.
-
Antagonistic crosstalk between NF-κB and SIRT1 in the regulation of inflammation and metabolic disorders.Cell Signal. 2013 Oct;25(10):1939-48. doi: 10.1016/j.cellsig.2013.06.007. Epub 2013 Jun 11. Cell Signal. 2013. PMID: 23770291 Review.
-
[The role of SIRT1 in the pathogenesis of insulin resistance in skeletal muscle].Postepy Hig Med Dosw (Online). 2015 Jan 16;69:63-8. doi: 10.5604/17322693.1136379. Postepy Hig Med Dosw (Online). 2015. PMID: 25614674 Review. Polish.
Cited by
-
SRT1720 improves survival and healthspan of obese mice.Sci Rep. 2011;1:70. doi: 10.1038/srep00070. Epub 2011 Aug 18. Sci Rep. 2011. PMID: 22355589 Free PMC article.
-
Sirtuin 1 is a key regulator of the interleukin-12 p70/interleukin-23 balance in human dendritic cells.J Biol Chem. 2012 Oct 12;287(42):35689-35701. doi: 10.1074/jbc.M112.391839. Epub 2012 Aug 14. J Biol Chem. 2012. PMID: 22893703 Free PMC article.
-
Effect of Exercise Training on Skeletal Muscle SIRT1 and PGC-1α Expression Levels in Rats of Different Age.Int J Med Sci. 2016 Mar 16;13(4):260-70. doi: 10.7150/ijms.14586. eCollection 2016. Int J Med Sci. 2016. PMID: 27076782 Free PMC article.
-
Adipocyte SIRT1 knockout promotes PPARγ activity, adipogenesis and insulin sensitivity in chronic-HFD and obesity.Mol Metab. 2015 Mar 5;4(5):378-91. doi: 10.1016/j.molmet.2015.02.007. eCollection 2015 May. Mol Metab. 2015. PMID: 25973386 Free PMC article.
-
The Role of Endoplasmic Reticulum Stress and NLRP3 Inflammasome in Liver Disorders.Int J Mol Sci. 2022 Mar 24;23(7):3528. doi: 10.3390/ijms23073528. Int J Mol Sci. 2022. PMID: 35408890 Free PMC article. Review.
References
-
- Arkan MC, Hevener AL, Greten FR, Maeda S, Li ZW, Long JM, Wynshaw-Boris A, Poli G, Olefsky J, Karin M. IKK-beta links inflammation to obesity-induced insulin resistance. Nat Med 11: 191–198, 2005 - PubMed
-
- Baur JA, Pearson KJ, Price NL, Jamieson HA, Lerin C, Kalra A, Prabhu VV, Allard JS, Lopez-Lluch G, Lewis K, Pistell PJ, Poosala S, Becker KG, Boss O, Gwinn D, Wang M, Ramaswamy S, Fishbein KW, Spencer RG, Lakatta EG, Le-Couteur D, Shaw RJ, Navas P, Puigserver P, Ingram DK, de-Cabo R, Sinclair DA. Resveratrol improves health and survival of mice on a high-calorie diet. Nature 444: 337–342, 2006 - PMC - PubMed
-
- Chen D, Steele AD, Lindquist S, Guarente L. Increase in activity during calorie restriction requires Sirt1. Science 310: 1641, 2005 - PubMed
-
- Cohen HY, Miller C, Bitterman KJ, Wall NR, Hekking B, Kessler B, Howitz KT, Gorospe M, de-Cabo R, Sinclair DA. Calorie restriction promotes mammalian cell survival by inducing the SIRT1 deacetylase. Science 305: 390–392, 2004 - PubMed
Publication types
MeSH terms
Substances
Grants and funding
LinkOut - more resources
Full Text Sources
Other Literature Sources
Medical
Research Materials