

Human mammary cancer progression model recapitulates methylation events associated with breast premalignancy
- PMID: 19995452
- PMCID: PMC2815551
- DOI: 10.1186/bcr2457
Human mammary cancer progression model recapitulates methylation events associated with breast premalignancy
Abstract
Introduction: We have previously identified a rare subpopulation of variant human mammary epithelial cells (vHMEC) with repressed p16INK4A that exist in disease-free women yet display premalignant properties, suggesting that they have engaged the process of malignant transformation. In order to gain insight into the molecular alterations required for vHMEC to progress to malignancy, and to characterize the epigenetic events associated with early progression, we examined the effect of oncogenic stress on the behavior of these cells.
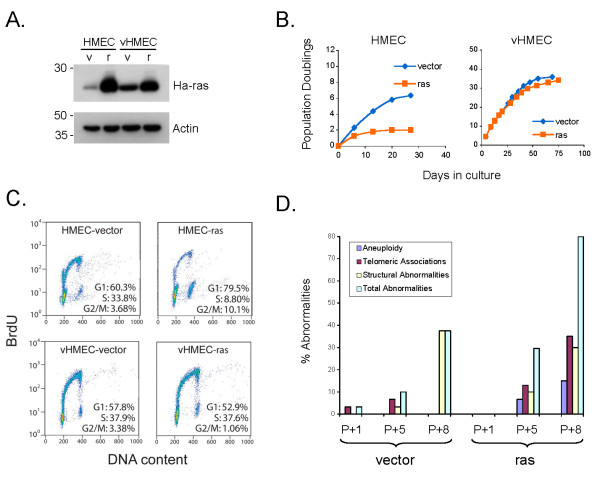
Methods: HMEC that express p16INK4A and vHMEC that do not, were transduced with constitutively active Ha-rasV12 and subsequently exposed to serum to determine whether signals from the cellular microenvironment could cooperate with ras to promote the malignant transformation of vHMEC. Epigenetic alterations were assessed using methylation-specific polymerase chain reaction (PCR).
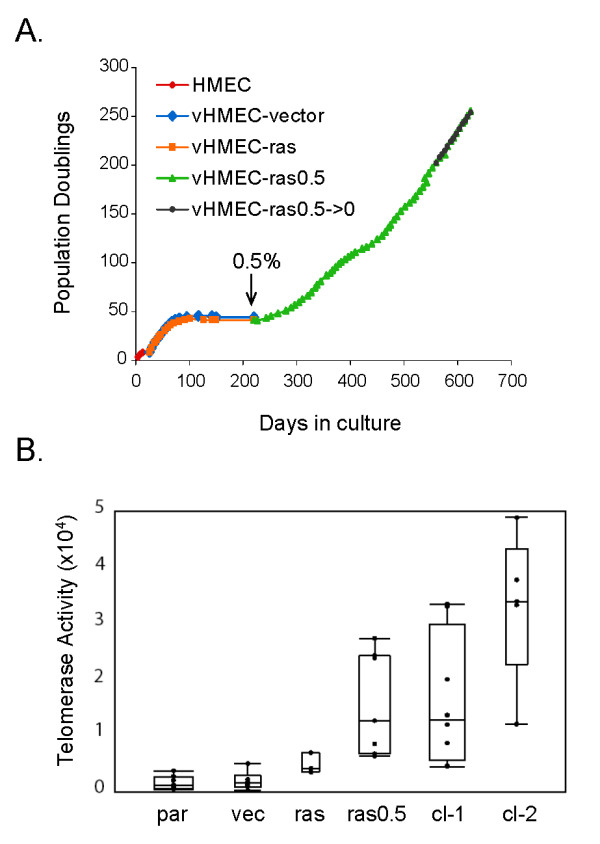
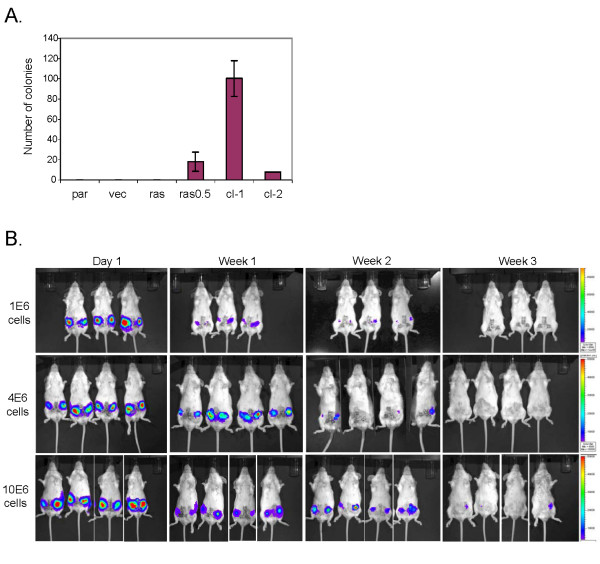
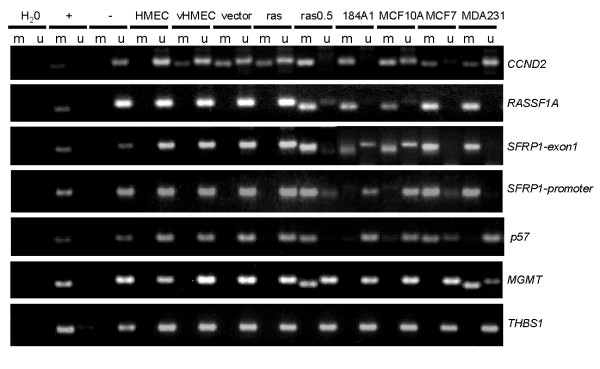
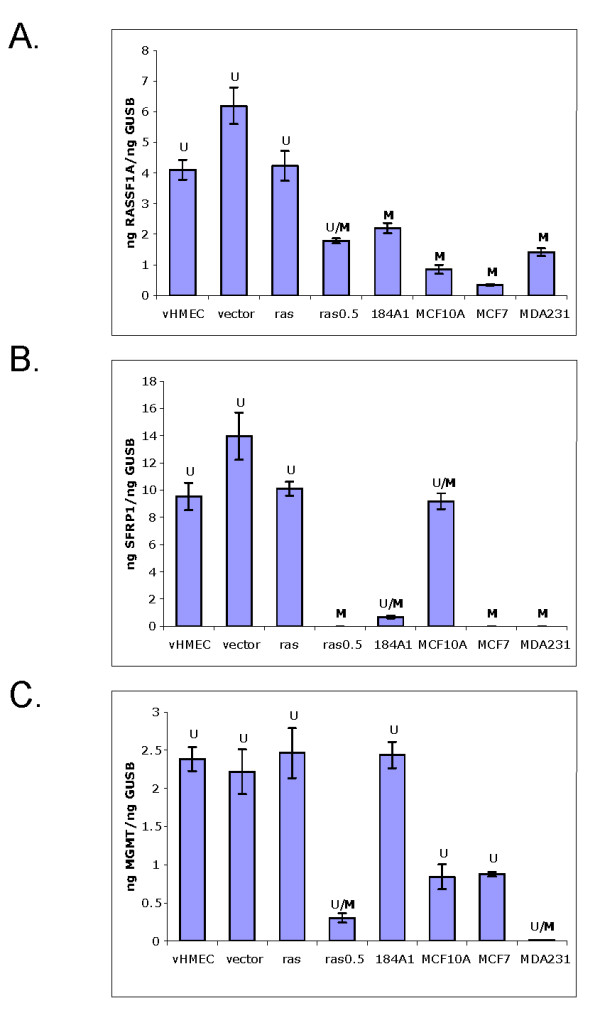
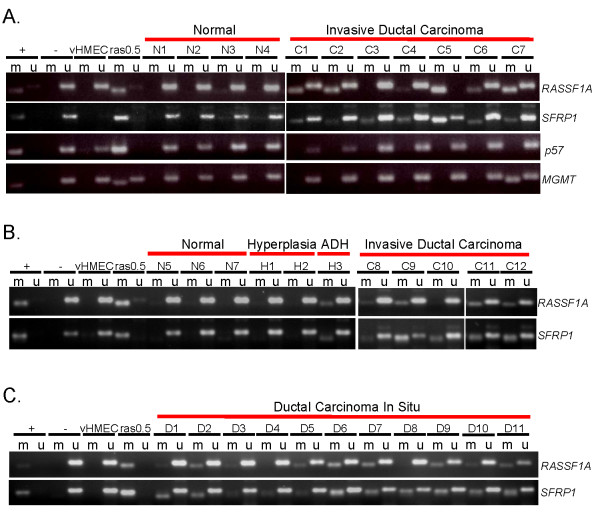
Results: vHMEC expressing Ha-rasV12 (vHMEC-ras) bypassed the classic proliferative arrest that has been previously documented in normal fibroblasts following oncogenic stress, and that we also observe here in normal HMEC. Moreover, vHMEC-ras cells exhibited many additional alterations that are observed during progression to malignancy such as the generation of chromosomal abnormalities, upregulation of telomerase activity, immortalization following exposure to serum, and anchorage-independent growth, but they did not form tumors following orthotopic injection in vivo. Associated with their early progression to malignancy was an increase in the number of genes methylated, two of which (RASSF1A and SFRP1) were also methylated in other immortalized mammary cell lines as well as in breast cancer cells and tissues.
Conclusions: We have characterized a mammary progression model that recapitulates molecular and methylation alterations observed in many breast cancers. Our data suggest that concomitant methylation of RASSF1A and SFRP1 marks an early event in mammary transformation and may thus have prognostic potential.
Figures
Similar articles
-
Promotion of variant human mammary epithelial cell outgrowth by ionizing radiation: an agent-based model supported by in vitro studies.Breast Cancer Res. 2010;12(1):R11. doi: 10.1186/bcr2477. Epub 2010 Feb 10. Breast Cancer Res. 2010. PMID: 20146798 Free PMC article.
-
Histologically normal human mammary epithelia with silenced p16(INK4a) overexpress COX-2, promoting a premalignant program.Cancer Cell. 2004 Mar;5(3):263-73. doi: 10.1016/s1535-6108(04)00023-6. Cancer Cell. 2004. PMID: 15050918
-
Immortalization of normal human mammary epithelial cells in two steps by direct targeting of senescence barriers does not require gross genomic alterations.Cell Cycle. 2014;13(21):3423-35. doi: 10.4161/15384101.2014.954456. Cell Cycle. 2014. PMID: 25485586 Free PMC article.
-
The introduction of activated oncogenes to mammary cells in vivo using retroviral vectors: a new model for the chemoprevention of premalignant and malignant lesions of the breast.J Cell Biochem Suppl. 1993;17G:66-72. doi: 10.1002/jcb.240531113. J Cell Biochem Suppl. 1993. PMID: 8007712 Review.
-
Mammary epithelial cell transformation: insights from cell culture and mouse models.Breast Cancer Res. 2005;7(4):171-9. doi: 10.1186/bcr1275. Epub 2005 Jun 3. Breast Cancer Res. 2005. PMID: 15987472 Free PMC article. Review.
Cited by
-
An adaptive Epithelial-Mesenchymal Transition Program Enables Basal Epithelial Cells to Bypass Stress-Induced Stasis and Contributes to Metaplastic Breast Cancer Progenitor State.Res Sq [Preprint]. 2024 Sep 27:rs.3.rs-4980285. doi: 10.21203/rs.3.rs-4980285/v1. Res Sq. 2024. Update in: Breast Cancer Res. 2024 Dec 18;26(1):184. doi: 10.1186/s13058-024-01920-8. PMID: 39399685 Free PMC article. Updated. Preprint.
-
Plasma Leptin, hTERT Gene Expression, and Anthropometric Measures in Obese and Non-Obese Women with Breast Cancer.Breast Cancer (Auckl). 2011 Mar 1;5:27-35. doi: 10.4137/BCBCR.S6734. Breast Cancer (Auckl). 2011. PMID: 21494399 Free PMC article.
-
Breast fibroblasts modulate early dissemination, tumorigenesis, and metastasis through alteration of extracellular matrix characteristics.Neoplasia. 2013 Mar;15(3):249-62. doi: 10.1593/neo.121950. Neoplasia. 2013. PMID: 23479504 Free PMC article.
-
Assessment of DNA methylation status in early stages of breast cancer development.Br J Cancer. 2013 May 28;108(10):2033-8. doi: 10.1038/bjc.2013.136. Epub 2013 May 7. Br J Cancer. 2013. PMID: 23652305 Free PMC article.
-
The Discovery of Novel Biomarkers Improves Breast Cancer Intrinsic Subtype Prediction and Reconciles the Labels in the METABRIC Data Set.PLoS One. 2015 Jul 1;10(7):e0129711. doi: 10.1371/journal.pone.0129711. eCollection 2015. PLoS One. 2015. PMID: 26132585 Free PMC article.
References
-
- Theillet C, Lidereau R, Escot C, Hutzell P, Brunet M, Gest J, Schlom J, Callahan R. Loss of a c-H-ras-1 allele and aggressive human primary breast carcinomas. Cancer Res. 1986;46:4776–4781. - PubMed
-
- Spandidos DA, Agnantis NJ. Human malignant tumours of the breast, as compared to their respective normal tissue, have elevated expression of the Harvey ras oncogene. Anticancer Res. 1984;4:269–272. - PubMed
-
- Hand PH, Vilasi V, Thor A, Ohuchi N, Schlom J. Quantitation of Harvey ras p21 enhanced expression in human breast and colon carcinomas. J Natl Cancer Inst. 1987;79:59–65. - PubMed
-
- Ohuchi N, Thor A, Page DL, Hand PH, Halter SA, Schlom J. Expression of the 21,000 molecular weight ras protein in a spectrum of benign and malignant human mammary tissues. Cancer Res. 1986;46:2511–2519. - PubMed
