. 2009 Dec;119(12):3556-72.
doi: 10.1172/JCI40115.

Global genomic analysis reveals rapid control of a robust innate response in SIV-infected sooty mangabeys

Affiliations

Global genomic analysis reveals rapid control of a robust innate response in SIV-infected sooty mangabeys

Steven E Bosinger et al. J Clin Invest. 2009 Dec.

Abstract

Natural SIV infection of sooty mangabeys (SMs) is nonprogressive despite chronic virus replication. Strikingly, it is characterized by low levels of immune activation, while pathogenic SIV infection of rhesus macaques (RMs) is associated with chronic immune activation. To elucidate the mechanisms underlying this intriguing phenotype, we used high-density oligonucleotide microarrays to longitudinally assess host gene expression in SIV-infected SMs and RMs. We found that acute SIV infection of SMs was consistently associated with a robust innate immune response, including widespread upregulation of IFN-stimulated genes (ISGs) in blood and lymph nodes. While SMs exhibited a rapid resolution of ISG expression and immune activation, both responses were observed chronically in RMs. Systems biology analysis indicated that expression of the lymphocyte inhibitory receptor LAG3, a marker of T cell exhaustion, correlated with immune activation in SIV-infected RMs but not SMs. Our findings suggest that active immune regulatory mechanisms, rather than intrinsically attenuated innate immune responses, underlie the low levels of immune activation characteristic of SMs chronically infected with SIV.


Figures

Figure 1
Figure 1. Experimental design, viral load, and CD4+ T cell kinetics in SIV-infected SMs and RMs.
(A) Comparison of transcriptional profiles in peripheral blood induced by SIV infection was conducted in 5 SMs infected with SIVsmm to represent a nonpathogenic infection; 4 RMs inoculated with SIVsmm to compare infection of a nonnatural host with an isogenic virus; and 8 RMs infected with SIVmac239 to represent a classical, pathogenic infection. Arrows indicate SIV infection, vertical lines indicate RNA sampling time points, and crosses indicate LN biopsy time points. SIVsmm-infected SMs (blue line) and RMs (black line) were sampled at days –5, 3, 7, 10, 14, and 30 (preinfection and acute) and 180 (chronic) after infection; SIVmac239-infected RMs (red line) were sampled at days –35, 9, 14, and 31 (preinfection and acute) and days 184–224 (chronic) after infection and were treated with ART and OKT8F mAb after day 50 after infection (see text and Methods for details), as indicated by the dashed line. During the chronic phase of infection in the SIVmac239 group, samples were collected at least 30 days after the last in vivo manipulation (i.e., ART and CD8+ lymphocyte depletion). (B) Longitudinal assessment of plasma viral load (RNA copies/ml plasma) in SMs (n = 5) and RMs (n = 4) infected with SIVsmm and RMs (n = 8) infected with SIVmac239. (C) Longitudinal analysis of the absolute numbers of CD3+CD4+ T lymphocytes per ml in peripheral blood, determined by flow cytometry. In B and C, the x axis shows time after SIV infection, and error bars indicate SEM.
Figure 2
Figure 2. Divergence in the transcriptome of SMs and RMs.
(A) PCA of complete gene-expression profiles measured on each individual array. PCA was performed on the log10-transformed, RMA-normalized intensities on individual arrays (52,024 probe sets per array) using a covariance dispersion matrix and normalized eigenvector scaling. Principal component (PC) no. 1 (37.4%), PC no. 2 (11.7%), and PC no. 3 (7.8%) accounted for 56.9% of the variance in the data. Each colored circle indicates complete expression profiles of individual samples, with similarity between data sets displayed as proximity in 3D space (SIVsmm-infected SMs, blue circles; SIVsmm-infected-RMs, black circles; SIVmac239-infected RMs, red circles). (B) Hierarchical clustering of individual array data sets was performed using a Euclidean metric and average linkage to determine distance between data sets and clusters, respectively. In A and B, data sets from the 3 infection groups are indicated by color: SIVsmm-infected SMs (blue), SIVsmm-infected RMs (black), and SIVmac239-infected RMs (red).
Figure 3
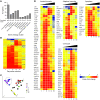
Figure 3. Gene-expression profile of the immune response to SIV infection in SMs.
(A) Ontology profiling of 428 probe sets significantly altered by SIV infection in SMs was based on gene ontology annotations retrieved from the DAVID Bioinformatics Database. Columns represent the number of genes in each ontology cluster listed below the x axis. Enrichment scores were calculated using the human genome as a background. (B) Hierarchical clustering of 428 genes significantly regulated by SIV infection in SMs was performed as described in Figure 1 legend. Clustering was performed on the average of log10 ratios of gene expression relative to levels before infection; fold changes were calculated by subtracting the log10 intensity preinfected measurement from after-infection measurement for individual animals prior to calculating the average. The dendrogram is not shown. (C) PCA of log10 intensity measurements of 428 differentially expressed probe sets. Colored circles represent data set for individual SMs at the time points indicated in the key. Ellipses are centered on the median of the following time points: days 0, 10, and 14. (D) Heat maps of selected innate immunity, adaptive immunity, apoptosis, and cell-cycle regulating genes with differential expression in SIV-infected SMs. Genes were categorized based on annotation in DAVID, Entrez Gene (http://www.ncbi.nlm.nih.gov/sites/entrez?db=gene), and Ingenuity Pathway Assist databases and on described function in the literature. Genes covered by multiple probe sets on the array are represented by the highest intensity. Genes were clustered as described in Figure 1 legend. Color scale is shown at bottom and ranges from 2-fold downregulated to 5-fold upregulated.
Figure 4
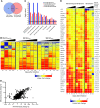
Figure 4. SMs and RMs exhibit distinct molecular signatures upon SIV infection.
(A) Venn diagram indicating overlap of /probe sets with differential expression in SMs and RMs in response to SIV infection. (B) Heat map of 1025 probe sets induced in SIVsmm-infected SMs and/or SIVmac239-infected RMs. Chr, chronic. (C) Ontology enrichment comparison of SIV-inducible genes was performed using Ingenuity Pathway Analysis. Genes with significant differential expression at day 10 and day 180 in SIVsmm-infected SMs and SIVmac239-infected RMs (indicated by colored bars) were analyzed for annotation against all genes for a given function in the Ingenuity database using right-tailed Fisher’s exact test. A significance threshold of P = 0.05 is indicated by the horizontal line. (D) Heat map of 43 probe sets significantly induced by SIVsmm infection in SMs and judged significantly different between infection groups. The heat maps depict probe sets with the largest magnitude of gene-expression fold change and/or known function in immune responses, apoptosis, or cell cycle. For B and D, genes were organized in heat maps using hierarchical clustering as described in Figure 1 legend and in Supplemental Methods. “Chronic” refers to day 180 in the SIVsmm-infected SMs and RMs and day 184–224 in SIVmac239-infected RMs. Relative gene-expression changes are depicted by the color scales below heat maps. (E) Correlation between relative fold changes measured by microarray and qPCR. Each point represents the fold change of a single gene relative to day 0 for individual animals at a given time point; x and y axes are microarray and qPCR log10 fold changes, respectively. Number of XY pairs = 969. Pearson’s r correlation = 0.6614; 95% CI = 0.6244 to 0.6954; P < 0.0001 (2-tailed).
Figure 5
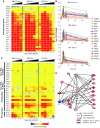
Figure 5. SIV infection in SMs induces extensive ISG expression during acute infection.
(A) Heat map of ISGs expressed during SIV infection in SMs and RMs. Genes were organized using hierarchical clustering as described in Supplemental Methods. ISG classification was limited to canonical ISGs and/or those with well-established IFN induction. (B) Longitudinal analysis of expression for 25 ISGs measured by microarray. (C) Heat map of type I and II IFNs and IFN pathway–regulating molecules. For A and C, the scale is indicated at bottom. (D) Network analysis of ISG expression was performed using Ingenuity Pathway Analysis Network Generation tool. Genes significantly regulated at day 10 in SIVsmm-infected SMs and SIVmac239-infected RMs were analyzed, and the top-scoring network was used as a starting reference and updated according to the most recent literature.
Figure 6
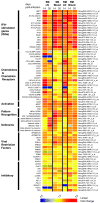
Figure 6. Gene-expression profiles in LNs of SIV-infected SMs and RMs.
Heat map of genes induced in LNs and blood at 14 and 30 days after infection with SIVsmm or SIVmac239. Differentially expressed genes in the LNs were defined as those determined significant (P < 0.05) by 2-sample Wilcoxon’s signed-rank test and an average 2-fold change relative to uninfected samples.
Figure 7
Figure 7. Comparative analysis of gene expression profile in response to SIV infection in lymph nodes and peripheral blood of SMs and RMs.
(A) Venn diagrams of Boolean relationships between sets of differentially expressed genes at day 14 after infection; the comparison groups are indicated at top, with the values in parentheses indicating the total number of differential probe sets in the respective data set; values within Venn diagrams indicate differential probe sets. (B) Functional pathway analysis was performed using the Ingenuity database as described in the Figure 4 legend. (C) Collections of dark staining α-defensin+ cells in blue-counterstained LN section from a representative SM section at day 30 after infection. Original magnification, ×20.
Figure 8
Figure 8. Systems biology identification of genes associated with immune activation in SIVmac239-infected RMs.
(A) Pearson’s correlation of CD8+Ki-67+ fraction with MKI67 gene expression in SIVmac239-infected RMs. Peripheral blood Ki-67+CD8+% was assessed using the gating strategy outlined in B and was correlated with MKI67 mRNA log10 intensity in peripheral blood using Pearson’s correlation (false discovery rate corrected; P < 0.00106). (B) Representative density plot of flow cytometry analysis for expression of Ki-67+ on gated CD3+CD8+ T cells in PBMCs of SIVmac239-infected RMs. The numbers denote the percentage of gated cells, indicating the fraction of CD3+ T cells expressing CD4 or CD8 (left panels) or the fraction of CD3+CD8+ T cells expressing Ki-67 (right panels) from a time point prior to SIV infection and from day 31 after infection in the same animal. (C) Longitudinal expression profile of Ki-67 protein on CD3+CD8+ T cells as measured by flow cytometry; error bars indicate SEM. (D) MIK67 mRNA as measured by microarray. MKI67 gene expression is the average ratio of gene expression relative to preinfected samples. (E) Longitudinal profiles of 4 genes whose expression significantly correlated with CD8+Ki-67+ percentage in peripheral blood and identified in the literature as related to immune activation, CD8+ T cell exhaustion, or HIV pathogenesis. (F) Model of immunomodulation during SIV infection of natural hosts and during pathogenic infection, demonstrating differences in ISG induction and immunoregulatory gene expression; details in text.

Comment in

Similar articles

Cited by

References

    1. Picker L.J. Immunopathogenesis of acute AIDS virus infection. Curr. Opin. Immunol. 2006;18:399–405. doi: 10.1016/j.coi.2006.05.001. - DOI - PubMed
    1. Mellors J.W., et al. Prognosis in HIV-1 infection predicted by the quantity of virus in plasma. Science. 1996;272:1167–1170. doi: 10.1126/science.272.5265.1167. - DOI - PubMed
    1. Douek D.C., Roederer M., Koup R.A. Emerging concepts in the immunopathogenesis of AIDS. Annu. Rev. Med. 2009;60:471–484. doi: 10.1146/annurev.med.60.041807.123549. - DOI - PMC - PubMed
    1. Sodora D.L., Silvestri G. Immune activation and AIDS pathogenesis. AIDS. 2008;22:439–446. doi: 10.1097/QAD.0b013e3282f2dbe7. - DOI - PubMed
    1. Aziz N., et al. Stability of plasma levels of cytokines and soluble activation markers in patients with human immunodeficiency virus infection. J. Infect. Dis. 1999;179:843–848. doi: 10.1086/314673. - DOI - PubMed

Publication types

MeSH terms