Tissue-specific differences in PD-1 and PD-L1 expression during chronic viral infection: implications for CD8 T-cell exhaustion
- PMID: 19955307
- PMCID: PMC2812396
- DOI: 10.1128/JVI.01579-09
Tissue-specific differences in PD-1 and PD-L1 expression during chronic viral infection: implications for CD8 T-cell exhaustion
Abstract
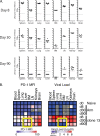
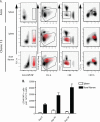
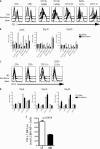
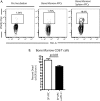
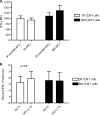
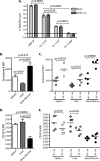
The PD-1/PD-L pathway plays a major role in regulating T-cell exhaustion during chronic viral infections in animal models, as well as in humans, and blockade of this pathway can revive exhausted CD8(+) T cells. We examined the expression of PD-1 and its ligands, PD-L1 and PD-L2, in multiple tissues during the course of chronic viral infection and determined how the amount of PD-1 expressed, as well as the anatomical location, influenced the function of exhausted CD8 T cells. The amount of PD-1 on exhausted CD8 T cells from different anatomical locations did not always correlate with infectious virus but did reflect viral antigen in some tissues. Moreover, lower expression of PD-L1 in some locations, such as the bone marrow, favored the survival of PD-1(Hi) exhausted CD8 T cells, suggesting that some anatomical sites might provide a survival niche for subpopulations of exhausted CD8 T cells. Tissue-specific differences in the function of exhausted CD8 T cells were also observed. However, while cytokine production did not strictly correlate with the amount of PD-1 expressed by exhausted CD8 T cells from different tissues, the ability to degranulate and kill were tightly linked to PD-1 expression regardless of the anatomical location. These observations have implications for human chronic infections and for therapeutic interventions based on blockade of the PD-1 pathway.
Figures


Similar articles
-
PD-L1 Checkpoint Inhibition Narrows the Antigen-Specific T Cell Receptor Repertoire in Chronic Lymphocytic Choriomeningitis Virus Infection.J Virol. 2020 Aug 31;94(18):e00795-20. doi: 10.1128/JVI.00795-20. Print 2020 Aug 31. J Virol. 2020. PMID: 32641478 Free PMC article.
-
4-1BB signaling synergizes with programmed death ligand 1 blockade to augment CD8 T cell responses during chronic viral infection.J Immunol. 2011 Aug 15;187(4):1634-42. doi: 10.4049/jimmunol.1100077. Epub 2011 Jul 8. J Immunol. 2011. PMID: 21742975 Free PMC article.
-
Restoring function in exhausted CD8 T cells during chronic viral infection.Nature. 2006 Feb 9;439(7077):682-7. doi: 10.1038/nature04444. Epub 2005 Dec 28. Nature. 2006. PMID: 16382236
-
Reinvigorating exhausted HIV-specific T cells via PD-1-PD-1 ligand blockade.J Exp Med. 2006 Oct 2;203(10):2223-7. doi: 10.1084/jem.20061800. Epub 2006 Sep 25. J Exp Med. 2006. PMID: 17000870 Free PMC article. Review.
-
[Role of programmed death-1 in viral infectious diseases].Zhongguo Dang Dai Er Ke Za Zhi. 2018 Jan;20(1):77-82. doi: 10.7499/j.issn.1008-8830.2018.01.016. Zhongguo Dang Dai Er Ke Za Zhi. 2018. PMID: 29335088 Free PMC article. Review. Chinese.
Cited by
-
Immune tolerance against infused FVIII in hemophilia A is mediated by PD-L1+ Tregs.J Clin Invest. 2022 Nov 15;132(22):e159925. doi: 10.1172/JCI159925. J Clin Invest. 2022. PMID: 36107620 Free PMC article.
-
Elevated frequencies of highly activated CD4+ T cells in HIV+ patients developing immune reconstitution inflammatory syndrome.Blood. 2010 Nov 11;116(19):3818-27. doi: 10.1182/blood-2010-05-285080. Epub 2010 Jul 26. Blood. 2010. PMID: 20660788 Free PMC article. Clinical Trial.
-
Dysfunction of Immune Systems and Host Genetic Factors in Hepatitis C Virus Infection with Persistent Normal ALT.Hepat Res Treat. 2011;2011:713216. doi: 10.1155/2011/713216. Epub 2011 Jun 14. Hepat Res Treat. 2011. PMID: 21760997 Free PMC article.
-
PDL1-positive exosomes suppress antitumor immunity by inducing tumor-specific CD8+ T cell exhaustion during metastasis.Cancer Sci. 2021 Sep;112(9):3437-3454. doi: 10.1111/cas.15033. Epub 2021 Jul 29. Cancer Sci. 2021. PMID: 34152672 Free PMC article.
-
Regulatory Mechanisms and Reversal of CD8+T Cell Exhaustion: A Literature Review.Biology (Basel). 2023 Apr 1;12(4):541. doi: 10.3390/biology12040541. Biology (Basel). 2023. PMID: 37106742 Free PMC article. Review.
References
-
- Ahmed, R., A. Salmi, L. D. Butler, J. M. Chiller, and M. B. Oldstone. 1984. Selection of genetic variants of lymphocytic choriomeningitis virus in spleens of persistently infected mice: role in suppression of cytotoxic T lymphocyte response and viral persistence. J. Exp. Med. 160:521-540. - PMC - PubMed
-
- Barber, D. L., E. J. Wherry, D. Masopust, B. Zhu, J. P. Allison, A. H. Sharpe, G. J. Freeman, and R. Ahmed. 2006. Restoring function in exhausted CD8 T cells during chronic viral infection. Nature 439:682-687. - PubMed
Publication types
MeSH terms
Substances
Grants and funding
LinkOut - more resources
Full Text Sources
Other Literature Sources
Research Materials

