. 2010 Jan;16(1):170-85.
doi: 10.1261/rna.1873910. Epub 2009 Nov 30.

Mature and functional viral miRNAs transcribed from novel RNA polymerase III promoters

Affiliations

Mature and functional viral miRNAs transcribed from novel RNA polymerase III promoters

Kevin W Diebel et al. RNA. 2010 Jan.

Abstract

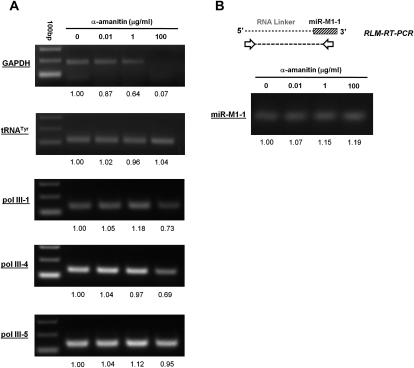
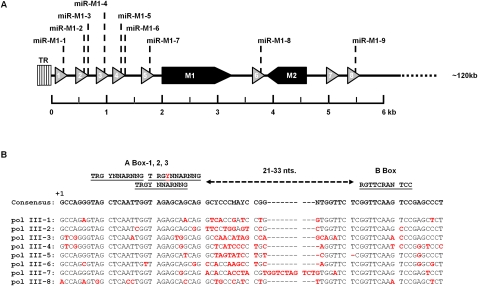
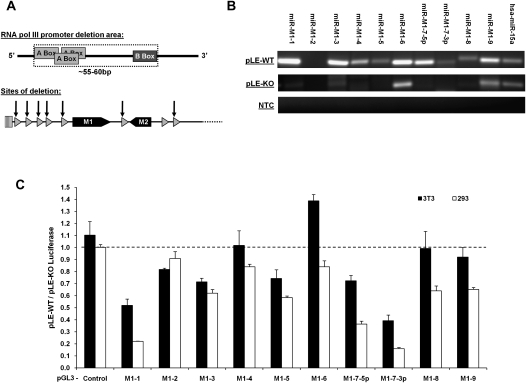
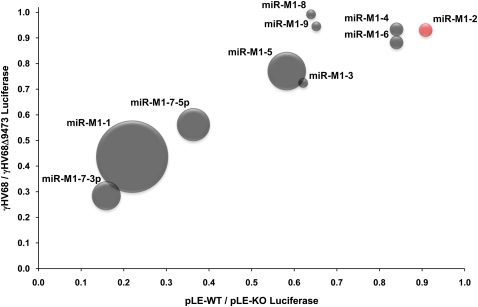
Murid herpesvirus 4 (MuHV-4) microRNAs were previously cloned from latently infected tumor cells and predicted to be processed from a series of RNA polymerase III primary transcripts. We detected maturely processed MuHV-4 miRNAs within total RNA from lytically infected cells in vitro and infected tissues ex vivo, using a highly sensitive reverse ligation meditated RT-PCR strategy. We determined that the MuHV-4 microRNAs are biologically active during infection by a luciferase reporter system. We experimentally demonstrated that transcription of the MuHV-4 microRNAs is by RNA polymerase III by alpha-amanitin insensitivity and by specific deletion of the RNA polymerase III type 2-like promoter elements of MuHV-4, resulting in the complete loss of miRNA detection and function. Finally, we demonstrate that these 10 viral miRNAs, each transcribed from highly conserved and novel polymerase III promoter elements, vary markedly in their relative abundance and activity.


Figures

FIGURE 1.
FIGURE 1.
Northern blot analysis of γHV68 pol III-1 during lytic infection. (A) Schematic of the predicted γHV68 pol III-1 transcript. RNA pol III type 2 internal promoter elements are shown as solid gray boxes. γHV68 miRNA miR-M1-1 is represented as a solid red box. γHV68 genomic coordinates are labeled in italics above the gene diagram. (B) Predicted secondary structure of the γHV68 pol III-1 transcript containing the lowest ΔG°37 value using the RNAstructure 4.6 software (Mathews et al. 2004). Nucleotides comprising miR-M1-1 are shown in red. (C) Northern blot of γHV68 pol III-1 from total RNA isolated from infected 3T3 cells collected at 6, 12, 24, and 36 h post infection. γHV68 pol III-1 transcript products are diagrammed to the right of the Northern blot. Ethidium bromide-stained 5S rRNA shown below serves as a loading control.
FIGURE 2.
FIGURE 2.
Dicer substrate (DS) processing, detection, and biological activities. (A) Schematic of miR-M1-1 and miR-M1-5 DSs. The entire molecule consists of ribonucleic acid nucleotides except for the two underlined bases that are deoxyribonucleic acid nucleotides. Arrows represent predicted dicer cut sites on the molecule. The bold bases represent the mature miRNA molecule. (B) Schematic of the pGL3-Luciferase plasmid constructs. pGL3-Control contains a short 3′UTR sequence with no miRNA target sequences, shown below the pGL3 diagram. pGL3-M1-1 contains the perfect complement sequence of γHV68 miRNA miR-M1-1 in its 3′UTR, shown in bold below the pGL3-M1-1 diagram, and serves as a target to gauge miR-M1-1 activity in transfected cells. (C,D) Dual luciferase reporter analysis from cotransfection experiments with the DS molecules and pGL3 reporter plasmids in 3T3 and 293 cells. pGL3 reporter and M1-1 DS cotransfections are shown as solid black bars, while pGL3 reporter and M1-5 DS cotransfections are shown as solid white bars. Data are shown as total firefly luciferase activity normalized to the renilla luciferase transfection control readings.
FIGURE 3.
FIGURE 3.
Detection of mature miRNAs using RLM-RT-PCR. (A) Schematic of the RLM-RT-PCR process for the detection of mature miRNAs. (B) RLM-RT-PCR of miRNAs miR-M1-1 and miR-M1-5 produced from the dicer substrates in transfected cells. Total RNA from the indicated cell types was used as template for the RLM-RT-PCR procedure. RT-PCR products were resolved by gel electrophoresis and visualized by ethidium bromide. Histogram representation of sequence analysis of the RT-PCR products from the dicer substrates is shown below the agarose gels. Each dicer substrate RLM-RT-PCR product in B was cloned, and 10 clones of each product were sequenced. The histograms show the position where the dicer substrate molecule ligated to the RNA linker oligo. Nucleotide position 21 is the predicted dicer cleavage site for these molecules and is boxed. Clones that yielded primer dimer products are not represented in the histogram. The gray lines represent clones sequenced from the untransfected dicer substrates. The solid black line represents clones sequenced from dicer substrates transfected into 3T3 cells. The dotted black line represents clones sequenced from dicer substrates transfected into 293 cells. (C) RLM-RT-PCR analysis of mature γHV68 miR-M1-1 and miR-M1-5 from γHV68 infected samples. Lytic in vitro RLM-RT-PCR products were amplified from RNA samples of 3T3 cells infected at an MOI = 5 with total RNA isolated at 6, 12, 24, and 36 h post infection. (D) Acute and latent ex vivo RLM-RT-PCR products were amplified from RNA of C57BL/6J mouse tissues collected at day 5 post-infection (acute) or day 16 post-infection (latent). All RLM-RT-PCR products were resolved and visualized using ethidium bromide staining. Bands were confirmed to be mature miR-M1-1 miRNAs by cloning and sequencing. Splen. indicates splenocytes cells; PC, peritoneal cells.
FIGURE 4.
FIGURE 4.
Detection and confirmation of biological activity of the γHV68 miRNAs during lytic infection in vitro. (A) RLM-RT-PCR for miRNAs in 3T3 cells infected with either γHV68 or γHV68Δ9473. mmu-miR-21 serves as an endogenous control for miRNA expression in 3T3 cells. RT-PCR products were resolved by gel electrophoresis and visualized by ethidium bromide. (B) RT-PCR for ORF 50, a marker of lytic infection for 3T3 cells infected with γHV68. Actin serves as a RT-PCR control for endogenous transcription in 3T3 cells. (C) Dual luciferase reporter analysis following infection with either the γHV68 or γHV68Δ9473 viruses. pGL3 luciferase reporter target is labeled below the graph. All results are displayed as a ratio of firefly luciferase expression in γHV68 infected cells divided by firefly luciferase expression in γHV68Δ9473 infected cells. Firefly luciferase readings are all normalized to the renilla luciferase transfection control. Readings obtained from 3T3 infected cells are shown in solid black bars; 293 cells, in solid white bars. Readings below the dashed line represent repression by the corresponding viral miRNA in γHV68 infected cells.
FIGURE 5.
FIGURE 5.
Demonstration of RNA pol III transcription of γHV68 miRNAs. 293 cells were infected with γHV68 and treated with α-amanitin at the indicated concentration. (A) RT-PCR analysis, with relative abundance of each RT-PCR product determined by densitometry analysis reported below the gels. (B) RLM-RT-PCR of miR-M1-1 products were cloned and sequenced to confirm the identity of the mature form of miR-M1-1. Primers for the cellular controls of the GAPDH and tRNATyr genes were used as previously described (Lee et al. 2004).
FIGURE 6.
FIGURE 6.
Features of the γHV68 RNA pol III coding locus. (A) The left end 6 kb of the γHV68 genome containing the γHV68 RNA pol III transcripts 1–8 is shown. γHV68 RNA pol III transcripts are represented as triangles shaded in gray. Two protein coding transcripts, M1 and M2, are shaded in black. TR indicates terminal repeat region. (B) The RNA pol III promoter sequences for each γHV68 pol III gene. All γHV68 pol III transcripts are aligned to the γHV68 consensus sequence of all γHV68 RNA pol III promoter regions, which is indicated above the alignments. Minimal spacing distance between the A box and B box is shown as 21–33 nt. The red letter within the A box-2 consensus sequence represents a nucleotide position that is not conserved in the γHV68 pol III promoter regions. The red letters within the γHV68 pol III transcript sequences are nucleotide positions that deviate from the γHV68 pol III consensus sequence.
FIGURE 7.
FIGURE 7.
Confirmation of the production of the γHV68 miRNAs by RNA pol III using the Left End plasmids. (A) Schematic of the γHV68 RNA pol III promoter deletion strategy. (B) RLM-RT-PCR for miRNAs in 293 cells transfected with either pLE-WT or the pLE-KO plasmids. hsa-miR-15a serves as an endogenous control for miRNA expression in 293 cells. RT-PCR products were resolved by gel electrophoresis and visualized by ethidium bromide. (C) Results from the dual luciferase reporter analysis following transfection with either the pLE-WT or pLE-KO plasmid. pGL3 luciferase reporter target is labeled below the graph. All results are displayed as a ratio of firefly luciferase expression in the pLE-WT transfected cells divided by firefly luciferase expression in the pLE-KO transfected cells. Firefly luciferase readings are all normalized to the renilla luciferase transfection control. Readings obtained from 3T3 transfected cells are shown in solid black bars; 293 cells, in solid white bars. Readings below the dashed line represent repression by the corresponding viral miRNA in pLE-WT transfected cells.
FIGURE 8.
FIGURE 8.
Correlation of viral miRNA expression with viral miRNA biological activity. Shown is a graphical representation of γHV68 miRNA activity during γHV68 infection and pLE-WT transfection of 293 cells in relation to the cloning frequency demonstrated for each viral miRNA within a latently infected tumor cell line (Pfeffer et al. 2005). The y-axis represents the γHV68 to γHV68Δ9473 firefly luciferase ratio within infected 293 cells established in Figure 4C. The x-axis represents the pLE-WT to pLE-KO luciferase ratio within transfected 293 cells established in Figure 7C. The size of each data point represents the cloning frequency of each miRNA within the latently infected tumor cell line (Pfeffer et al. 2005). The color of each data point represents our ability to identify the maturely processed γHV68 miRNA product from γHV68 infected or pLE-WT transfected 293 cells. Gray data points are positive for our ability to detect these miRNAs; the red data point for miR-M1-2 indicates that we were unable to detect this miRNA during γHV68 infection or pLE-WT transfection. The correlation coefficient for the biological activity of all 10 γHV68 miRNAs between viral infection of 293 cells compared with transfection of the pLE-WT plasmid within 293 cells is R2 = 0.833. The correlation coefficient for the biological activity of the γHV68 miRNAs (except miR-M1-8 and miR-M1-9, which did not give appreciable biological activity within lytic infection of 293 cells) is R2 = 0.9627.

Similar articles

Cited by

References

    1. Alvarez-Garcia I, Miska EA. MicroRNA functions in animal development and human disease. Development. 2005;132:4653–4662. - PubMed
    1. Andersson MG, Haasnoot PCJ, Xu N, Berenjian S, Berkhout B, Akusjärvi G. Suppression of RNA interference by adenovirus virus-associated RNA. J Virol. 2005;79:9556–9565. - PMC - PubMed
    1. Bartel DP. MicroRNAs: Genomics, biogenesis, mechanism, and function. Cell. 2004;116:281–297. - PubMed
    1. Blaskovic D, Stanceková M, Svobodová J, Mistríková J. Isolation of five strains of herpesviruses from two species of free living small rodents. Acta Virol. 1980;24:468. - PubMed
    1. Borchert GM, Lanier W, Davidson BL. RNA polymerase III transcribes human microRNAs. Nat Struct Mol Biol. 2006;13:1097–1101. - PubMed

Publication types

MeSH terms

LinkOut - more resources