

Disruption of inducible 6-phosphofructo-2-kinase ameliorates diet-induced adiposity but exacerbates systemic insulin resistance and adipose tissue inflammatory response
- PMID: 19948719
- PMCID: PMC2823512
- DOI: 10.1074/jbc.M109.058446
Disruption of inducible 6-phosphofructo-2-kinase ameliorates diet-induced adiposity but exacerbates systemic insulin resistance and adipose tissue inflammatory response
Abstract
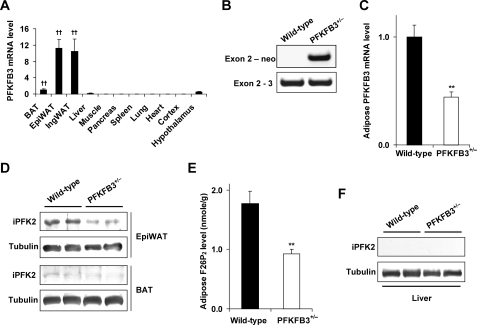
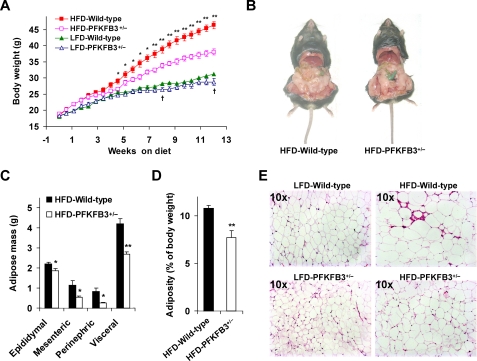
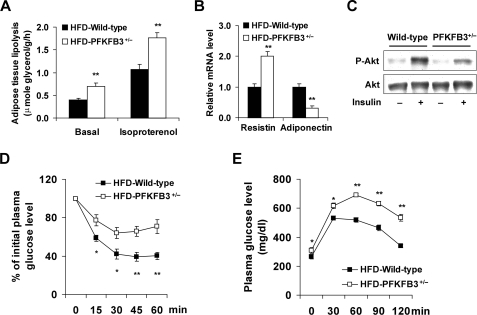
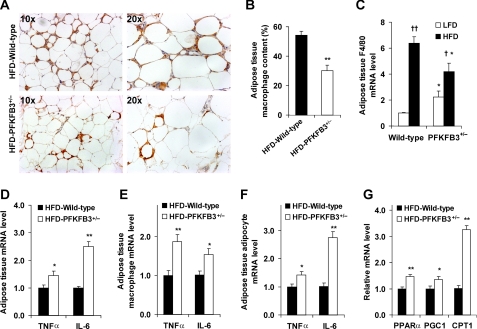
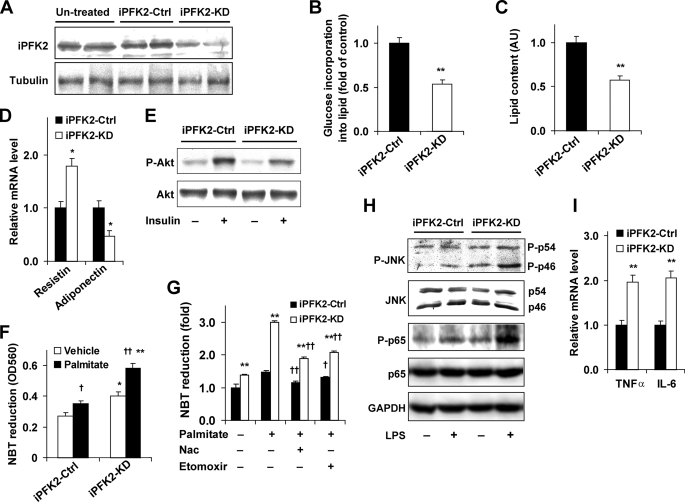
Adiposity is commonly associated with adipose tissue dysfunction and many overnutrition-related metabolic diseases including type 2 diabetes. Much attention has been paid to reducing adiposity as a way to improve adipose tissue function and systemic insulin sensitivity. PFKFB3/iPFK2 is a master regulator of adipocyte nutrient metabolism. Using PFKFB3(+/-) mice, the present study investigated the role of PFKFB3/iPFK2 in regulating diet-induced adiposity and systemic insulin resistance. On a high-fat diet (HFD), PFKFB3(+/-) mice gained much less body weight than did wild-type littermates. This was attributed to a smaller increase in adiposity in PFKFB3(+/-) mice than in wild-type controls. However, HFD-induced systemic insulin resistance was more severe in PFKFB3(+/-) mice than in wild-type littermates. Compared with wild-type littermates, PFKFB3(+/-) mice exhibited increased severity of HFD-induced adipose tissue dysfunction, as evidenced by increased adipose tissue lipolysis, inappropriate adipokine expression, and decreased insulin signaling, as well as increased levels of proinflammatory cytokines in both isolated adipose tissue macrophages and adipocytes. In an in vitro system, knockdown of PFKFB3/iPFK2 in 3T3-L1 adipocytes caused a decrease in the rate of glucose incorporation into lipid but an increase in the production of reactive oxygen species. Furthermore, knockdown of PFKFB3/iPFK2 in 3T3-L1 adipocytes inappropriately altered the expression of adipokines, decreased insulin signaling, increased the phosphorylation states of JNK and NFkappaB p65, and enhanced the production of proinflammatory cytokines. Together, these data suggest that PFKFB3/iPFK2, although contributing to adiposity, protects against diet-induced insulin resistance and adipose tissue inflammatory response.
Figures
Similar articles
-
Involvement of inducible 6-phosphofructo-2-kinase in the anti-diabetic effect of peroxisome proliferator-activated receptor gamma activation in mice.J Biol Chem. 2010 Jul 30;285(31):23711-20. doi: 10.1074/jbc.M110.123174. Epub 2010 May 24. J Biol Chem. 2010. PMID: 20498376 Free PMC article.
-
Disruption of inducible 6-phosphofructo-2-kinase impairs the suppressive effect of PPARγ activation on diet-induced intestine inflammatory response.J Nutr Biochem. 2013 May;24(5):770-5. doi: 10.1016/j.jnutbio.2012.04.007. Epub 2012 Jul 26. J Nutr Biochem. 2013. PMID: 22841546 Free PMC article.
-
Targeted overexpression of inducible 6-phosphofructo-2-kinase in adipose tissue increases fat deposition but protects against diet-induced insulin resistance and inflammatory responses.J Biol Chem. 2012 Jun 15;287(25):21492-500. doi: 10.1074/jbc.M112.370379. Epub 2012 May 3. J Biol Chem. 2012. PMID: 22556414 Free PMC article.
-
Secreted proteins from adipose tissue and skeletal muscle - adipokines, myokines and adipose/muscle cross-talk.Arch Physiol Biochem. 2011 May;117(2):47-56. doi: 10.3109/13813455.2010.535835. Epub 2010 Dec 15. Arch Physiol Biochem. 2011. PMID: 21158485 Review.
-
Central adiposity, systemic inflammation, and the metabolic syndrome.Curr Hypertens Rep. 2010 Apr;12(2):99-104. doi: 10.1007/s11906-010-0096-4. Curr Hypertens Rep. 2010. PMID: 20424938 Review.
Cited by
-
Involvement of inducible 6-phosphofructo-2-kinase in the anti-diabetic effect of peroxisome proliferator-activated receptor gamma activation in mice.J Biol Chem. 2010 Jul 30;285(31):23711-20. doi: 10.1074/jbc.M110.123174. Epub 2010 May 24. J Biol Chem. 2010. PMID: 20498376 Free PMC article.
-
Metformin ameliorates hepatic steatosis and inflammation without altering adipose phenotype in diet-induced obesity.PLoS One. 2014 Mar 17;9(3):e91111. doi: 10.1371/journal.pone.0091111. eCollection 2014. PLoS One. 2014. PMID: 24638078 Free PMC article.
-
Nutritional approaches for managing obesity-associated metabolic diseases.J Endocrinol. 2017 Jun;233(3):R145-R171. doi: 10.1530/JOE-16-0580. Epub 2017 Apr 11. J Endocrinol. 2017. PMID: 28400405 Free PMC article. Review.
-
Type 2 Diabetes Dysregulates Glucose Metabolism in Cardiac Progenitor Cells.J Biol Chem. 2016 Jun 24;291(26):13634-48. doi: 10.1074/jbc.M116.722496. Epub 2016 May 5. J Biol Chem. 2016. PMID: 27151219 Free PMC article.
-
Mice lacking adenosine 2A receptor reveal increased severity of MCD-induced NASH.J Endocrinol. 2019 Sep 1:JOE-19-0198.R1. doi: 10.1530/JOE-19-0198. Online ahead of print. J Endocrinol. 2019. PMID: 31505462 Free PMC article.
References
-
- Kusunoki M., Hara T., Tsutsumi K., Nakamura T., Miyata T., Sakakibara F., Sakamoto S., Ogawa H., Nakaya Y., Storlien L. H. (2000) Diabetologia 43, 875–880 - PubMed
-
- Gallou-Kabani C., Vigé A., Gross M. S., Rabès J. P., Boileau C., Larue-Achagiotis C., Tomé D., Jais J. P., Junien C. (2007) Obesity 15, 1996–2005 - PubMed
-
- Llagostera E., Carmona M. C., Vicente M., Escorihuela R. M., Kaliman P. (2009) FEBS Letters 583, 2121–2125 - PubMed
-
- Miyazaki Y., Glass L., Triplitt C., Wajcberg E., Mandarino L. J., DeFronzo R. A. (2002) Am. J. Physiol. Endocrinol. Metab. 283, E1135–E1143 - PubMed
Publication types
MeSH terms
Substances
Grants and funding
LinkOut - more resources
Full Text Sources
Medical
Molecular Biology Databases
Research Materials
