. 2009 Dec 10;462(7274):745-56.
doi: 10.1038/nature08624.

X-ray structure, symmetry and mechanism of an AMPA-subtype glutamate receptor

Affiliations

X-ray structure, symmetry and mechanism of an AMPA-subtype glutamate receptor

Alexander I Sobolevsky et al. Nature. .

Abstract

Ionotropic glutamate receptors mediate most excitatory neurotransmission in the central nervous system and function by opening a transmembrane ion channel upon binding of glutamate. Despite their crucial role in neurobiology, the architecture and atomic structure of an intact ionotropic glutamate receptor are unknown. Here we report the crystal structure of the alpha-amino-3-hydroxy-5-methyl-4-isoxazole propionic acid (AMPA)-sensitive, homotetrameric, rat GluA2 receptor at 3.6 A resolution in complex with a competitive antagonist. The receptor harbours an overall axis of two-fold symmetry with the extracellular domains organized as pairs of local dimers and with the ion channel domain exhibiting four-fold symmetry. A symmetry mismatch between the extracellular and ion channel domains is mediated by two pairs of conformationally distinct subunits, A/C and B/D. Therefore, the stereochemical manner in which the A/C subunits are coupled to the ion channel gate is different from the B/D subunits. Guided by the GluA2 structure and site-directed cysteine mutagenesis, we suggest that GluN1 and GluN2A NMDA (N-methyl-d-aspartate) receptors have a similar architecture, with subunits arranged in a 1-2-1-2 pattern. We exploit the GluA2 structure to develop mechanisms of ion channel activation, desensitization and inhibition by non-competitive antagonists and pore blockers.


Figures
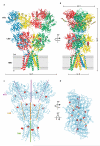
Figure 1
Figure 1. Architecture of homomeric rat GluA2 receptor
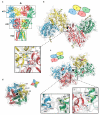
a, View of the ‘broad’ face of the receptor, perpendicular to the overall 2-fold axis of molecular symmetry. Each subunit is in different color. b, View of the ‘narrow’ face of the receptor. c-d, Axes of symmetry viewed parallel to the membrane (c) or from the extracellular ‘top’ of the receptor, along the overall 2-fold axis of symmetry (d). Axes of local symmetry for the domains ATD, LBD and TMD are shown in purple, orange and green, respectively. For ATD and LBD, thin lines represent axes of intradimer two-fold symmetry and thick lines represent axes of interdimer two-fold symmetry. For TMD, the thick green line represents the local axis of four-fold symmetry. Red mesh peaks (c,d) define mercury sites derived from an anomalous difference Fourier map of a GluA2cryst mercury derivative. The contour level is 5.0 σ.
Figure 2
Figure 2. Domain symmetry and architecture
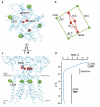
a, GluA2cryst structure viewed perpendicular to the overall 2-fold axis. b-d, Domain layers viewed from the ‘top’ of the receptor, parallel to overall 2-fold axis. The simple schematics depict the symmetry and arrangement of domains within each layer. b, The ATD layer. Boxed region highlights dimer-dimer contacts, with overall 2-fold axis (large black oval) in the center. The local, intradimer 2-fold axes of symmetry are shown as smaller black ovals. Subunits B and D are proximal and subunits A and C are distal to the overall 2-fold axis, respectively. c, The LBD layer with the dimer-dimer contacts on and off the overall 2-fold axis shown in panels 2 and 3, respectively. In this layer, subunits A and C are proximal to the overall 2-fold axis. d, The TMD layer and its 4-fold rotational symmetry (black square).
Figure 3
Figure 3. Transmembrane domain architecture
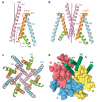
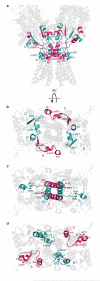
Fold of transmembrane domain for subunit A (a) and for subunits A and B (b) viewed parallel to the membrane. Transmembrane segments M1 to M4 are depicted in different colors. The ‘vertical’ black line defines the 4-fold symmetry axis. Dashed lines indicate disordered regions. c-d, TMD viewed parallel to the 4-fold axis. c, TM segments are colored as in panels (a,b). d, Surface representation of subunits B to D. For subunit A, the segments M1-M4 are shown as green cylinders.
Figure 4
Figure 4. Probing intersubunit interfaces in GluA2 AMPA receptors
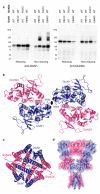
a, Ribbon diagram of the GluA2cryst structure with each subunit in a different color. b-d, Close ups of intersubunit interfaces between two ATD dimers (b), two LBD dimers (c) and at the top of the ion channel (d). e-g, SDS PAGE analysis of spontaneous crosslinking of cysteines introduced at intersubunit interfaces. Left and right panels illustrate experiments carried out in reducing and non-reducing conditions, respectively. Filled and open triangles indicate positions of monomeric and dimeric bands, respectively.
Figure 5
Figure 5. Subunit arrangement in NMDA receptors
a, Western blot analysis of crosslinking of wild type GluN1-GluN2A (WT) and cysteine-substituted NMDA receptors probed with anti-GluN1 (left) and anti-GluN2A (right) antibodies. b, Model of LBD dimerof-dimers built by superposing two GluN1-GluN2A dimers onto the GluA2cryst structure, viewed along the axis of overall two-fold symmetry. Residues substituted with cysteines are shown in green. c, Model of the NMDA receptor ion channel based the GluA2cryst structure and viewed along the axis of pseudo four-fold symmetry. d, Simple model of NMDA receptor architecture based on GluA2cryst structure and using the GluN1-GluN2A LBD heterodimer structure together with the GluA2cryst ATDs and TMDs.
Figure 6
Figure 6. Subunit non equivalence and ‘domain swapping’
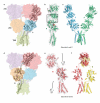
a, α-Carbon trace of subunit A and partially transparent solvent accessible surface of the entire receptor. b, Conformation of subunit A. c, Position and conformation of subunits A and C in the intact receptor. d, α-Carbon trace of subunit B showing ‘domain swapping’ in going from the ATD to the LBD layers. e, Conformation of subunit B. f, Position and conformation of subunits B and D in the intact receptor. Note the large differences of the ATD-LBD linkers and interfaces between the A/C and B/D subunit pairs.
Figure 7
Figure 7. 2-fold to 4-fold symmetry transition
a, Ion channel viewed from the cytoplasm, parallel to the local 4-fold axis of symmetry. Mercury (green mesh) and selenium (red mesh) sites, defined by anomalous difference electron density, contoured at 5.0 σ and 2.6 σ, respectively. b, Geometry of the mercury and selenium sites from panel (a). c, View of TMD perpendicular to its local 4-fold axis of molecular symmetry. d, Graph showing the r.m.s. deviations of α-carbon positions following transformation of the A subunit on the B subunit by applying the local 4-fold axis of symmetry, emphasizing that the 2-fold to 4-fold symmetry transition occurs between the LBDs and the membrane embedded TMD.
Figure 8
Figure 8. Gating ‘machinery’ accommodates symmetry mismatch
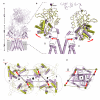
a, LBDs and TMDs of GluA2cryst viewed perpendicular to the overall 2-fold axis of molecular symmetry. The elements mediating symmetry mismatch between LBDs and TMDs – the S1-M1, M3-S2 and S2-M4 linkers – are colored pink (subunits A and C) or blue (subunits B or D). b-d, The elements resolving symmetry mismatch between the LBDs and the TMDs viewed from the cytoplasm, parallel to the ion channel 4-fold axis of symmetry. b, The S1-M1 linker, (c) the M3-S2 linker and (d) the S2-M4 linker.
Figure 9
Figure 9. Closed conformation of the ion channel pore
a, Sagittal section of the GluA2cryst receptor illustrates that the occlusion of the putative ion permeation pathway, or the ion channel gate, is formed by the crossing of the M3 helices. b,c, Surface representation of the ion conduction pathway (b) and the pore diameter as a function of distance along the central axis of the channel (c) generated using the program HOLE (red < 1.4 Å < green < 2.8 Å < purple). Residues forming the narrowest portions of the ion conduction pathway are indicated. d, The A/C and B/D M3 segments adopt distinct conformations at their C-termini, proximal to the LBDs. Helical regions are shown as cylinders and colored green for TMD and orange for LBD. Residues forming the narrowest portions of the ion conduction pathway are highlighted in red. e, M3 residues forming the narrowest portion of the ion conduction pathway.
Figure 10
Figure 10. Closed state conformations of iGluR and K+ channels are similar
Two diagonal subunits (a) and their bundle crossing (b) in GluA2cryst channel (blue) and KcsA channel (grey) viewed parallel to the membrane. Channels were superimposed by aligning main-chain atoms of the M3 and M1 segments in iGluR with the inner and outer helices in KcsA, respectively. Residues forming the narrowest portions of the ion conduction pathway are shown as stick models.
Figure 11
Figure 11. iGluR activation gating
a, The structure of GluA2cryst with two subunits (A and C) transparent. Red dashed line indicates interface between LBD and TMD. b, Closeup of the LBD-TMD regions of subunits B and D. The structure of the water-soluble GluA2 LBD (S1S2) crystallized in complex with glutamate has been superimposed, using the D1 domain, on the corresponding region of GluA2cryst and is shown in green. Helical regions of the ion channel as well as parts of LBD that move upon iGluR activation are shown as cylinders. Purple and green spheres indicate positions of the α-carbons for the residues Lys 393 and Pro 632. Stick models of ZK200775 and glutamate are shown in purple and green, respectively. Red arrows indicate movement during iGluR activation. c-d, Views of the iGluR tetramer from interface between LBD and TMD (red dashed line in a) onto (c) LBD along the overall axis of the two-fold symmetry and (d) ion channel along the axis of four-fold symmetry. Gray dashed lines outline borders of the A, B, C, and D subunits. Purple and green lines connect Pro 632 α-carbon atoms.
Figure 12
Figure 12. iGluR desensitization
a, Structure of GluA2cryst subunits A and D (purple) with superposed structure of the S729C dimer LBD (orange). Red dashed line indicates interface between ATD and LBD. Purple and orange spheres indicate positions of the α-carbons for the residues Lys 393 and Pro 632. Stick models of ZK200775 and glutamate are shown in purple and orange, respectively. Red arrows indicate movement of Lys 393 during GluR desensitization. b-c, Views on the GluA2cryst tetramer along the overall axis of two-fold symmetry from interface between ATD and LBD (red dashed line in a) looking into the ATD (b) and into the LBD (c). Gray dashed lines define boundaries of the A, B, C, and D subunits.

Comment in

Similar articles

Cited by

References

    1. Cowan WM, Sudhof TC, Stevens CF, editors. Synapses. The Johns Hopkins University Press; Baltimore, MD: 2001.
    1. Hayashi T. Effects of sodium glutamate on the nervous system. Keio J. Med. 1954;3:183–192.
    1. Curtis DR, Phillis JW, Watkins JC. Chemical excitation of spinal neurons. Nature. 1959;183:611. - PubMed
    1. Sugiyama H, Ito I, Watanabe M. Glutamate receptor subtypes may be classified into two major categories: A study on Xenopus oocytes injected with rat brain mRNA. Neuron. 1989;3:129–132. - PubMed
    1. Dingledine R, Borges K, Bowie D, Traynelis SF. The glutamate receptor ion channels. Pharmacological Rev. 1999;51:7–61. - PubMed

Publication types

Substances