. 2009 Oct;65(4 Suppl):A29-43.
doi: 10.1227/01.NEU.0000351279.78110.00.

Magnetic resonance neurography and diffusion tensor imaging: origins, history, and clinical impact of the first 50,000 cases with an assessment of efficacy and utility in a prospective 5000-patient study group

Affiliations

Magnetic resonance neurography and diffusion tensor imaging: origins, history, and clinical impact of the first 50,000 cases with an assessment of efficacy and utility in a prospective 5000-patient study group

Aaron Filler. Neurosurgery. 2009 Oct.

Abstract

Objective: Methods were invented that made it possible to image peripheral nerves in the body and to image neural tracts in the brain. The history, physical basis, and dyadic tensor concept underlying the methods are reviewed. Over a 15-year period, these techniques-magnetic resonance neurography (MRN) and diffusion tensor imaging-were deployed in the clinical and research community in more than 2500 published research reports and applied to approximately 50,000 patients. Within this group, approximately 5000 patients having MRN were carefully tracked on a prospective basis.

Methods: A uniform Neurography imaging methodology was applied in the study group, and all images were reviewed and registered by referral source, clinical indication, efficacy of imaging, and quality. Various classes of image findings were identified and subjected to a variety of small targeted prospective outcome studies. Those findings demonstrated to be clinically significant were then tracked in the larger clinical volume data set.

Results: MRN demonstrates mechanical distortion of nerves, hyperintensity consistent with nerve irritation, nerve swelling, discontinuity, relations of nerves to masses, and image features revealing distortion of nerves at entrapment points. These findings are often clinically relevant and warrant full consideration in the diagnostic process. They result in specific pathological diagnoses that are comparable to electrodiagnostic testing in clinical efficacy. A review of clinical outcome studies with diffusion tensor imaging also shows convincing utility.

Conclusion: MRN and diffusion tensor imaging neural tract imaging have been validated as indispensable clinical diagnostic methods that provide reliable anatomic pathological information. There is no alternative diagnostic method in many situations. With the elapsing of 15 years, tens of thousands of imaging studies, and thousands of publications, these methods should no longer be considered experimental.


Figures

Figure 1
Figure 1
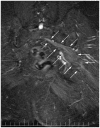
The first Diffusion Tractographic Imaging case. This image is primarily the work of Todd Richards and shows the use of spatial diffusion information to highlight a neural tract curving through brain. This is the brain of a long-tailed macaque monkey (Macaca fascicularis) imaged as part of an effort to improve the sensitivity of MRI for the early detection of encephalomyelitis. Reproduced from: Filler AG, Tsuruda JS, Richards TL, Howe FA: Images, apparatus, algorithms and methods. GB 9216383, UK Patent Office, 1992 and also: Filler AG, Tsuruda JS, Richards TL, Howe FA: Image Neurography and Diffusion Anisotropy Imaging. US 5,560,360, Unites States Patent Office, 1993 (28, 29).
Figure 2
Figure 2
Nerve water compartments. MR pulse sequences can be optimized to detect water signal arising in one of several compartments. Important nerve water components with unique characteristics for MRI include the endoneurial fluid, axoplasmic water, organelle water and myelin associated water.
Figure 3
Figure 3
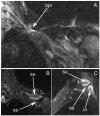
Relations of a small C5 mass to brachial plexus elements. In many cases, by collecting images in planes that are perpendicular to the main longitudinal axis of the nerve elements of interest, it is possible to obtain extremely specific information about the location of a mass within the brachial plexus. A, multiplanar reformat oriented parallel to the main longitudinal orientation of the brachial plexus. B, oblique acquisition perpendicular to the orientation of the main longitudinal direction of the brachial plexus.
Figure 4
Figure 4
Relations of brachial plexus elements to an axillary mass. Although schwannomas can be detected by various techniques, it is extremely valuable for the surgeon to have a method of determining the position of the nerve elements relative to the position of the mass. Bp – brachial plexus, sc – schwannoma.
Figure 5
Figure 5
Upper trunk brachial plexus injury with denervation of C5 muscles. A) There is an apparent discontinuity of the C5 component of the upper trunk. The C6 component is swollen upstream of the injury and sharply narrowed and hyperintense. B) Coronal view and C) nerve perpendicular view showing severe denervation changes in supraspinatus and infraspinatus muscles. Bpi – brachial plexus injury, su – supraspinatus, in – infraspinatus, ss – scapular spine.
Figure 6
Figure 6
Right and left side comparison of a patient suffering from right sided thoracic outlet syndrome. The image demonstrates several types of abnormality detectable by MR Neurography relative to the normal side. There is increased caliber and image intensity of nerve elements on the left and two sites of impingement. A sharp focal downward distortion at the lateral border of the scalene triangle and then a gently sloped upward distortion over the first rib. Sc – scalene border, 1st – first rib.
Figure 7
Figure 7
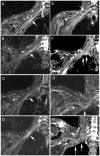
Varying degrees of severity of brachial plexus entrapment in thoracic outlet syndromes. A) Linear plexus with short segment of mild hyperintensity consistent with nerve irritative changes near the later border of the scalene triangle; B) Evidence of more restrictive fibrosis associated with narrowing and brightening of plexus elements near the scalene border – note linear plexus despite elevated shoulder; C) Short segment of marked hyperintensity with slight swelling; D) Severe multiple element abnormality with narrowed and swollen segments, and marked hyperintensity; E) Linear normal plexus with isolated focal impingement of C5 spinal nerve, just proximal to the scalene triangle; F) Fibrous band causing sharp downward distortion of mid and lower trunk proximal to scalene triangle, with second sharp upward distortion of lower trunk near scalene insertion at the first rib; G) Moderate restrictive impingement of plexus at scalene triangle causing generalized distortion of the course of the plexus with short segment of focal hyperintensity; H) Patient presenting with severe pain, numbness and weakness from progressive thoracic outlet syndrome – multiple points of sharp nerve course distortion with edema and hyperintensity affecting multiple brachial plexus elements.
Figure 8
Figure 8
Extraforaminal impingement of descending L5 spinal nerve by lateral marginal osteophyte distal to the foramen. Drg – dorsal root ganglion, lmo – lateral marginal osteophyte.
Figure 9
Figure 9
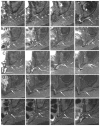
Comparison of sciatic nerve appearance at the sciatic notch in patients with hyperintensity and in normal patients. Cases A and B demonstrate hyperintensity in the sciatic nerve in a series of images as the nerve exits the sciatic notch and descends below the level of the piriformis tendon. In normal cases C, D, E the sciatic nerve is nearly isointense with surrounding muscle tissue. Sciatic nerve indicated by arrow in all images.
Figure 10
Figure 10
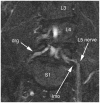
Bilateral split sciatic nerve at piriformis muscle in patient with bilateral piriformis syndrome. Among the most important aspects of pre-operative planning in management of sciatic nerve entrapments in the pelvis is the identification of patients with a split sciatic nerve partly passing through the piriformis muscle. This image demonstrated the S1 spinal roots, spinal nerves, LS plexus, and split peroneal and tibial components of the sciatic nerve (arrows) as they are deviated by segments of the piriformis muscle bilaterally.
Figure 11
Figure 11
Severe focal compression of the sciatic nerve at the sciatic notch. The nerve is flattened, hyperintense and expanded to more than twice its normal diameter. This is a post-operative result that occurred when only one of the two bipartite elements of the piriformis muscle was released in a patient with split nerve and split muscle. Differential retraction of the cut piriformis segment relative to the intact segment caused a severe mechanical impingement syndrome.
Figure 12
Figure 12
Pudendal nerve entrapment between the ischial spine and the Alcock canal. In patients with unilateral pudendal entrapment in the Alcock canal, it is typical to see asymmetric swelling and hyperintensity affecting the pudendal neurovascular bundle. Note increased caliber and hyperintensity at the left pudendal nerve indicated by the left arrow. Figure reproduced with permission from: Filler AG: Diagnosis and management of pudendal nerve entrapment syndromes: impact of MR Neurography and open MR-guided injections. Neurosurgery Quarterly 18:1–6, 2008 (20).
Figure 13
Figure 13
Distal pudendal nerve neurographic image anatomy. The pudendal nerve in the Alcock canal (AC) runs along the medial aspect of the obturator internus muscle (OI) medial to the ischial tuberosity (IT). The rectal branch of the nerve (RB) is well seen in most imaging cases (Re = rectum). Figure reproduced with permission from: Filler AG: Diagnosis and management of pudendal nerve entrapment syndromes: impact of MR Neurography and open MR-guided injections. Neurosurgery Quarterly 18:1–6, 2008 (20).
Figure 14
Figure 14
Isotropic and anisotropic diffusion of water molecules in diffusion MRI. Shades of gray intensity indicate the intensity of the magnetic field which varies across the image plane due to the imposed pulsed magnetic field gradient. Water diffuses in all directions in most non-neural tissues (isotropically) but diffuses preferentially along the long axis of nerves (anisotropically). When all the water molecules in a tissue experience identical magnetic field strength despite diffusion movements, the MR signal from that tissue remains bright relative to the signal decay in surrounding isotropically diffusing tissue water. This is the situation on the left where the magnetic gradient is oriented perpendicular to the nerve. In the situation on the right, the water molecules in nerve move preferentially to different positions in the gradients more rapidly than in the non-neural tissue so that the signal remains brighter from non-neural tissue.
Figure 15
Figure 15
Diffusion tensor imaging (DTI) data has been used to seed various tractographic assessments of this patient’s brain. These are seen in superior (A), posterior (B), and lateral views (C&D). The seeds have been used to develop arcuate and superior longitudinal fasciculi in (A) and (B), for brainstem, and corona radiata in (C), and as combined data sets in (D). Some of the two dimensional projections of the tractographic result are also shown. The data set may be rotated continuously into various planes to better appreciate the structure. Color has been assigned based on the dominant direction of the fibers. There is asymmetry in the tractographic fiber volume between the right and left arcuate fasciculus (Raf & Laf) (smaller on the left) and between the right and left superior longitudinal fasciculus (Rslf & Lslf) (smaller on the right). Also seen are Tapetum (Ta), Left corona radiata (Lcr) and Left middle cerebellar peduncle (Lmcp).
Figure 16
Figure 16
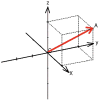
A Cartesian orthogonal frame of reference depicting Vector A. The measurement of the projection of this vector onto each of the three axes, X, Y and Z is two units. Because all of the measurements are positive, the vector (A) points into the octant of space bound on each side by the positive half of each axis.
Figure 17
Figure 17
Explanation of Anti-Symmetric Dyadic Tensor For each of three graph series (I – III) there are four different rotations shown to help with visualization. I) For diffusion measurements along each axis, the direction (sign) is not known. In this example the neural tract is running along the diagonal of the voxel so the measurements on X, Y and Z are equal. As shown, the ambiguity leads to eight possible vectors (1 & 1a - blue; 2 & 2a - purple; 3 & 3a - red; 4 & 4a turquoise) along the four diagonals of the space. This uncertainty arises when only three orthogonal diffusion directions are measured. Each vector runs along a diagonal in one of the eight possible octants of this Cartesian space. We know that six of the vectors must be artifactual “ghosts” but we must use three more diffusion gradient acquisition directions to distinguish the ghosts from the dyad that actually represents the true neural tract orientation. II) To clarify the situations, two more gradient axes have been measured, each of which was oriented along one of the diagonals of the space. A green plane determined by these two new measurement lines has been drawn. Notice that this plane incorporates the red (3 & 3a) and the turquoise (4 & 4a) vector pairs. Because our measurement was near zero in these two directions, we can discard the four vectors in these four octants. III) A sixth gradient measure has now been made. This also had a very low intensity (rapid decay) we know we can discard the two vectors in these two octants as well. A yellow plane that incorporates the red (3 & 3a) and the purple (2 & 2a) vectors is shown to demonstrate how the actual vector can have length along all six Cartesian axes but not be zeroed by the two diagonal planes. Notice that by observing the various rotations, we see that the dyad made up of the blue vectors (1 and 1a) runs in the octants that remain. This shows how six measurements can orient the dyad and determine which of four possibilities is the true tractographic course.

Similar articles

Cited by

References

    1. Aagaard BD, Maravilla KR, Kliot M. MR neurography. MR imaging of peripheral nerves. Magnetic resonance imaging clinics of North America. 1998;6:179–194. - PubMed
    1. Aagaard BD, Maravilla KR, Kliot M. Magnetic resonance neurography: magnetic resonance imaging of peripheral nerves. Neuroimaging clinics of North America. 2001;11:viii, 131–146. - PubMed
    1. Abrose J, Hounsfield G. Computerized transverse axial tomography. Br J Radiol. 1973;46:148–149. - PubMed
    1. Basser PJ, LeBihan D. Fiber orientation mapping in an anisotropic medium with NMR diffusion spectroscopy. Presented at Society for Magnetic Resonance in Medicine 11th Annual Meeting; Berlin, Germany. 1992.
    1. Basser PJ, Mattiello J, LeBihan D. MR diffusion tensor spectroscopy and imaging. Biophysical journal. 1994;66:259–267. - PMC - PubMed

Publication types

MeSH terms