. 2009 Nov;17(5):649-61.
doi: 10.1016/j.devcel.2009.09.004.

MOR23 promotes muscle regeneration and regulates cell adhesion and migration

Affiliations

MOR23 promotes muscle regeneration and regulates cell adhesion and migration

Christine A Griffin et al. Dev Cell. 2009 Nov.

Abstract

Odorant receptors (ORs) in the olfactory epithelium bind to volatile small molecules leading to the perception of smell. ORs are expressed in many tissues but their functions are largely unknown. We show multiple ORs display distinct mRNA expression patterns during myogenesis in vitro and muscle regeneration in vivo. Mouse OR23 (MOR23) expression is induced during muscle regeneration when muscle cells are extensively fusing and plays a key role in regulating migration and adhesion of muscle cells in vitro, two processes common during tissue repair. A soluble ligand for MOR23 is secreted by muscle cells in vitro and muscle tissue in vivo. MOR23 is necessary for proper skeletal muscle regeneration as loss of MOR23 leads to increased myofiber branching, commonly associated with muscular dystrophy. Together these data identify a functional role for an OR outside of the nose and suggest a larger role for ORs during tissue repair.


Figures

Figure 1
Figure 1. Multiple ORs are expressed during in vitro myogenesis and muscle regeneration
Real Time RT-PCR was used to analyze the time-course of expression both in vitro and in vivo for 19 ORs. A) During myotube formation the majority of myoblasts (red) differentiate into myocytes (blue). Myocytes fuse with one another to form small nascent myotubes with few nuclei. Subsequently, nascent myotubes fuse with myocytes to form large myotubes with many nuclei. B) Two patterns of expression were observed in vitro: peak expression either during proliferation or after terminal differentiation. Olfr15 and Olfr16 (MOR23) are shown. C) The number of ORs with highest expression levels at each time point in vitro. The majority of ORs are expressed in proliferating cells at 0 hrs in DM; however several ORs are also expressed at 24 hrs in DM, during the fusion process. D) Three patterns were observed in vivo: peak expression in uninjured muscle and increased expression day 5 or day 10 after injury. Olfr15, Olfr16 (MOR23) and Olfr71 are shown. E) The number of ORs with highest expression levels at each time point in vivo. The majority of ORs demonstrated peak expression at day 5 after injury, with few ORs showing peak expression either earlier or later. All data are mean ± SEM.
Figure 2
Figure 2. MOR23 regulates myocyte migration during myogenesis
A) Real Time RT-PCR indicates MOR23 mRNA was significantly increased at 24 hrs in DM. Data were normalized to 18S rRNA (*p<0.05 from 0). B) Immunoblots for MOR23 and OR signaling proteins; Gαolf and membrane adenylyl cyclase III (mACIII) at 24 hrs in DM. Tubulin was used as a loading control. C) Immunoblots indicate MOR23 protein was decreased at least 58% by MOR23 siRNA. D) Myocytes from control or MOR23 siRNA cultures were treated with lyral and levels of cAMP were determined (* p<0.05 from control; ** p<0.05 from lyral). E) Myocytes from control or MOR23 siRNA cultures were allowed to migrate to conditioned media. MOR23 siRNA decreased migration by 55% compared to control (* p<0.05; ** p<0.01 from control). F) Myocyte velocity was calculated from 3 hrs of time-lapse microscopy with 20 cells analyzed in each of 3 isolates. Minor decreases in velocity were observed in MOR23 siRNA cultures at 24 hrs in DM. G) MOR23 OE cells at 24 hr in DM demonstrated increased levels of cell surface MOR23 compared to control; immunoblots were performed after cell surface biotinylation and biotin pull-down. H) Myocytes from control or MOR23 OE cells were allowed to migrate to dilutions of CM. MOR23 OE myocytes exhibited increased migration at all concentrations of CM compared to control (* p<0.05). I) Control or MOR23 siRNA myocytes were allowed to migrate in Boyden chambers to crushed muscle extract. Control siRNA myocytes increased migration to CME 2.5-fold, but MOR23 siRNA myocytes did not. J) Control or MOR23 OE myocytes were allowed to migrate in Boyden chambers to CME. Migration of MOR23 OE myocytes to CME was increased 3-fold compared to control myocytes (* p<0.05). All data are mean ± SEM.
Figure 3
Figure 3. MOR23 regulates directed migration of myocytes to lyral
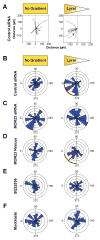
A) Migratory paths of myocytes tracked for 3 hrs with pictures every 5 min in a representative Dunn chamber experiment with 15-20 cells in each graph. Lyral gradient was highest at left side. B-F) Circular histogram plots summarizing Dunn chamber data from 3-5 independent cell isolates with 15-20 cells analyzed in each experiment. Lyral gradient was highest at left side. Red line and arc indicate the mean direction and 99% confidence interval for conditions in which significant clustering of cell migration occurred. B, C) Control cells exhibited directed migration to lyral which was abolished in MOR23 siRNA cells. D) Migration to lyral is MOR23-specific as MOR23 siRNA cells rescued by MOR23 OE exhibited directed migration. E) Migration is dependent on membrane adenylyl cyclase function as inhibitor SQ22536 abrogated directed migration to lyral. F) Myoblasts, which express Olfr1403 but not MOR23, did not exhibit directed migration towards lyral.
Figure 4
Figure 4. Loss of MOR23 or OR signaling alters cell-cell adhesion
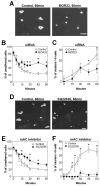
A) Myocytes infected with control or MOR23 siRNA were incubated in suspension for 60 min with aliquots taken regularly, to determine the percentage of un-adhered and adhered cells by phase-contrast microscopy (Bar=50μm). B) MOR23 siRNA cells displayed a significantly higher percentage of un-adhered cells at later time points than control (* p<0.05). C) MOR23 siRNA cells exhibited fewer clusters with > 5 cells (* p<0.05). D) Myocytes were suspended in media containing a mAC inhibitor, SQ22536, or vehicle (Bar=50μm). E) SQ22536-treated cells displayed a significantly higher percentage of un-adhered cells at later time points (* p<0.05). F) SQ22536-treated cells formed small clusters (* p<0.05). All data are mean ± SEM.
Figure 5
Figure 5. Myotube formation is regulated by MOR23
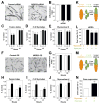
A) Control or MOR23 siRNA 2 and 3 cells immunostained for eMyHC at 24 hrs in DM (Bar=50μm). B) No difference was observed in the percentage of nuclei in eMyHC+ cells at 24 hrs in DM (differentiation index). C) The fusion index in MOR23 siRNA cultures was transiently decreased at 24 hrs in DM (* p<0.001). D) The number of myotubes in MOR23 siRNA cultures was transiently decreased at 24 hrs in DM (* p<0.001). E) Myonuclear number in MOR23 siRNA cultures was decreased at both 24 and 48 hrs in DM (* p<0.05; ** p<0.01). F) Control (C) or MOR23 OE (M) cells were immunostained for eMyHC at 24 hrs in DM (Bar=50μm). G) No difference was observed in the percentage of nuclei in eMyHC+ cells at 24 or 48 hrs in DM. H) The fusion index in MOR23 OE cultures was increased at 24 and 48 hours in DM (* p<0.05; ** p<0.01). I) The number of myotubes in MOR23 OE cultures was increased at 24 and 48 hrs in DM (* p<0.05; ** p<0.01). J) Myonuclear number in MOR23 OE cultures was increased at 24 and 48 hrs in DM (* p<0.01). K) Nascent myotubes infected with control or MOR23 siRNA were labeled orange and mixed with control or MOR23 siRNA myocytes labeled green. After 24 hrs of co-culture, cultures were fixed and myotubes analyzed for dual labeling. L) With MOR23 siRNA in myocytes the percentage of myotubes with dual label was decreased 20% relative to control; however, MOR23 siRNA in myotubes had no affect (* p<0.001). M) Control nascent myotubes were mixed with control or MOR23 OE myocytes and analyzed as in K. N) With MOR23 OE in myocytes, the percentage of myotubes with dual label was increased 35% relative to control (* p<0.05). All data are mean ± SEM.
Figure 6
Figure 6. Changes in MOR23 expression affect muscle regeneration
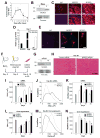
A) Real Time RT-PCR for MOR23 mRNA in gastrocnemius muscles at different times post-injury. All days are normalized to 18S rRNA and expressed as fold increase over 0 days (* p<0.01). B) Immunoblot for MOR23 at 0 and 5 days with a portion of the Ponceau-stained blot shown as control. C) Muscles 5 days post-injury immunostained for MOR23 or control IgG (Bar=25μm). MOR23+ regenerating myofibers are shown at higher magnification in last panels (Bar=10μm). Overlay in bottom panels indicates DAPI-stained nuclei. D) Mononucleated cells were isolated from gastrocnemius muscles 5 days post-injury and immunostained with antibodies to CD31 (FITC), CD45 (FITC) and α7-integrin (PE): CD31+CD45+, to identify endothelial and immune cells and α7-integrin+CD31-CD45- for myogenic cells. Real Time RT-PCR for MOR23, myogenin (Myg), and Mac1 mRNA in α7-integrin+CD31-CD45- cells or α7-integrin-CD31+CD45+ cells. All genes are normalized to 18S rRNA and expressed as mean pg of RNA from N=2; 7 mice each. E) Mononucleated α7-integrin+CD31-CD45- muscle cells isolated from gastrocnemius muscles 5 days post-injury, were plated and immunostained for MOR23. A single MOR23+ cells is shown at higher magnification in right panel (Bars=10μm). F) Gastrocnemius muscles were induced to regenerate using BaCl2 2 days prior to electroporation of control or MOR23 plasmids. Muscles were isolated 5, 10 or 20 days post-electroporation; uninjured muscles were collected from contra-lateral day 20 legs. G) Immunoblot demonstrating knockdown of MOR23 protein at day 5 with section of Ponceau-stained blot shown as control. H) Control or MOR23 siRNA muscles stained with hematoxylin and eosin (Bar=100μm). I) The cross-sectional area (XSA) of regenerating myofibers was decreased with MOR23 siRNA (* p<0.05 from control, # p<0.05 from uninjured). J) The frequency of small regenerating myofibers increased with MOR23 siRNA. K) The number of regenerating myofibers increased with MOR23 siRNA (* p<0.05 from control, # p<0.05 from uninjured). L) The cross-sectional area (XSA) of regenerating myofibers was increased with MOR23 OE (* p<0.05 from control, # p<0.05 from uninjured). M) The frequency of small regenerating myofibers decreased with MOR23 OE. N) The number of regenerating myofibers decreased with MOR23 OE (* p<0.05 from control, # p<0.05 from uninjured). All data are mean ± SEM unless stated otherwise.
Figure 7
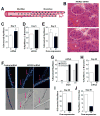
Figure 7. MOR23 regulates myofiber branching
A) Schematic of myofiber branching in which a single myofiber is contiguous with several smaller myofibers. Nuclei are blue and mono-nucleated cells are small red circles. B) Gastrocnemius muscles isolated 5 days after electroporation of plasmid were analyzed for myofibers that were a single myofiber in one section and multiple myofibers occupying the same area in a second section, 170μm away. Stars indicate the same myofiber in both sections, a branched myofiber is circled (Bar=50μm). C) Myofiber branching was increased with MOR23 siRNA. D) The number of branches per myofiber increased with MOR23 siRNA. Data are percentage of total myofibers. E) Myofiber branching was not affected at day 5 with MOR23 OE. F) Myofibers were isolated from gastrocnemius muscles 10 or 20 days after electroporation of plasmid. DAPI-stained centrally located nuclei and phase-contrast microscopy determined if regenerating myofibers exhibited branching. Arrows indicate a branched regenerating myofiber, arrow-head an unbranched regenerating myofiber (Bar=50μm). G) Muscles with MOR23 siRNA contained more branched regenerating myofibers. H) The number of branches per myofiber increased with MOR23 siRNA. I) Muscles with MOR23 OE contained fewer branched regenerating myofibers. Data are percentage of total myofibers. J) The number of branches per myofiber decreased with MOR23 OE. All data are mean ± SEM unless stated otherwise.

Similar articles

Cited by

References

    1. Abbott KL, Friday BB, Thaloor D, Murphy TJ, Pavlath GK. Activation and cellular localization of the cyclosporine A-sensitive transcription factor NF-AT in skeletal muscle cells. Mol Biol Cell. 1998;9:2905–2916. - PMC - PubMed
    1. Abbott KL, Loss JR, 2nd, Robida AM, Murphy TJ. Evidence that Galpha(q)-coupled receptor-induced interleukin-6 mRNA in vascular smooth muscle cells involves the nuclear factor of activated T cells. Mol Pharmacol. 2000;58:946–953. - PubMed
    1. Allen DL, Teitelbaum DH, Kurachi K. Growth factor stimulation of matrix metalloproteinase expression and myoblast migration and invasion in vitro. Am J Physiol Cell Physiol. 2003;284:C805–815. - PubMed
    1. Beggs ML, Nagarajan R, Taylor-Jones JM, Nolen G, Macnicol M, Peterson CA. Alterations in the TGFbeta signaling pathway in myogenic progenitors with age. Aging Cell. 2004;3:353–361. - PubMed
    1. Bondesen BA, Mills ST, Kegley KM, Pavlath GK. The COX-2 pathway is essential during early stages of skeletal muscle regeneration. Am J Physiol Cell Physiol. 2004;287:C475–483. - PubMed

Publication types