. 2009 Oct 30;139(3):597-609.
doi: 10.1016/j.cell.2009.10.004.

Retinoic acid from the meninges regulates cortical neuron generation

Affiliations

Retinoic acid from the meninges regulates cortical neuron generation

Julie A Siegenthaler et al. Cell. .

Erratum in

  • Cell. 2011 Aug 5;146(3):486

Abstract

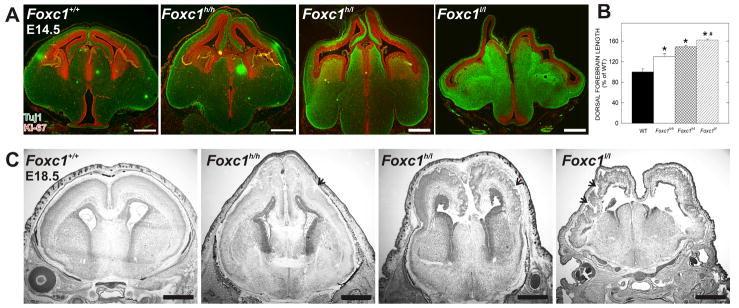
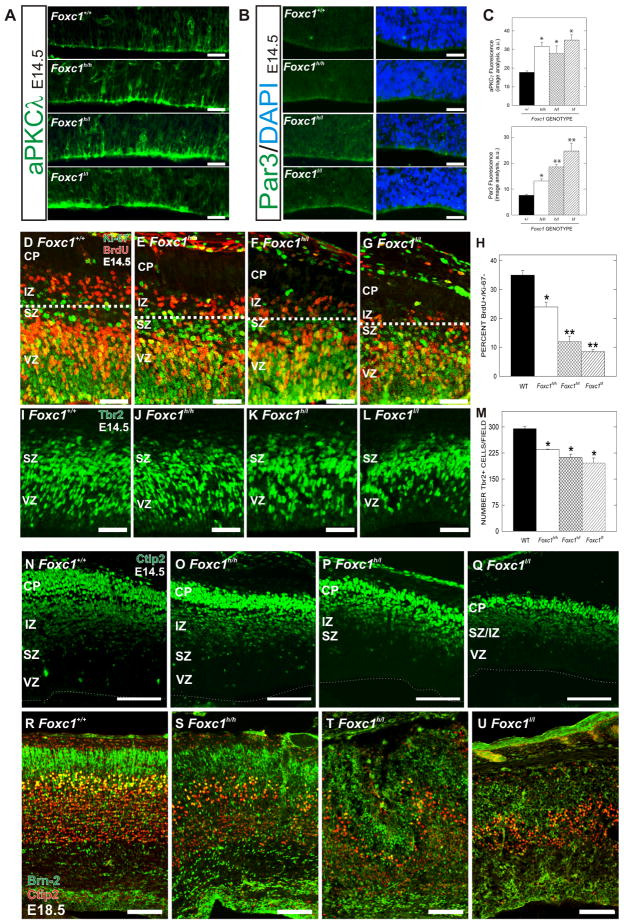
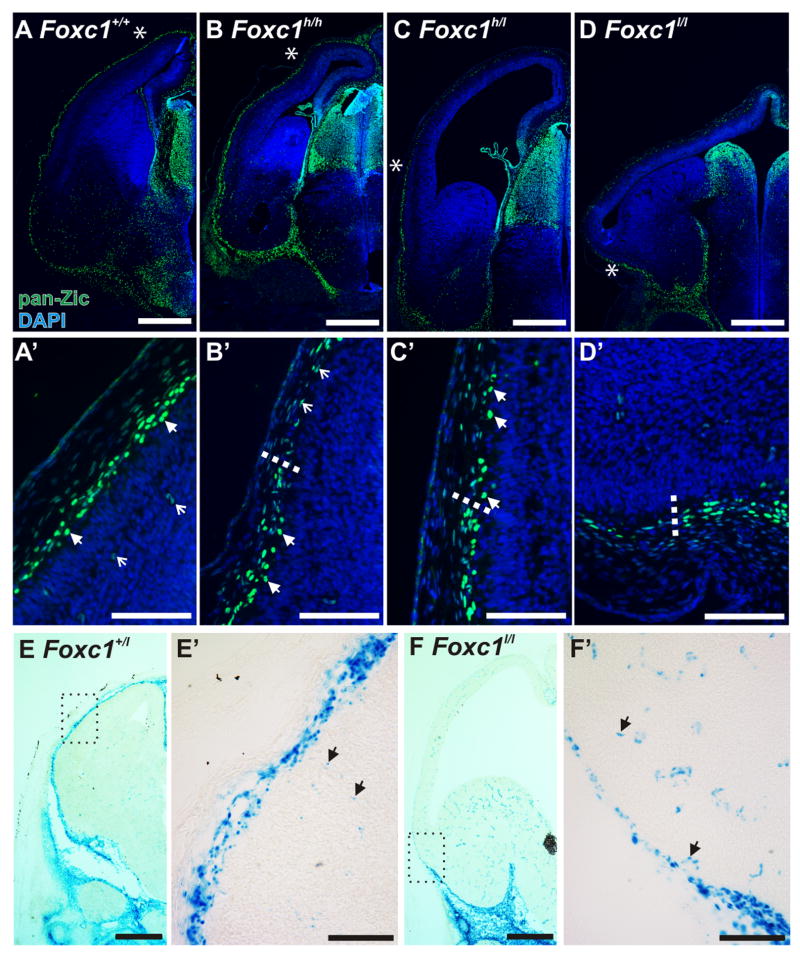
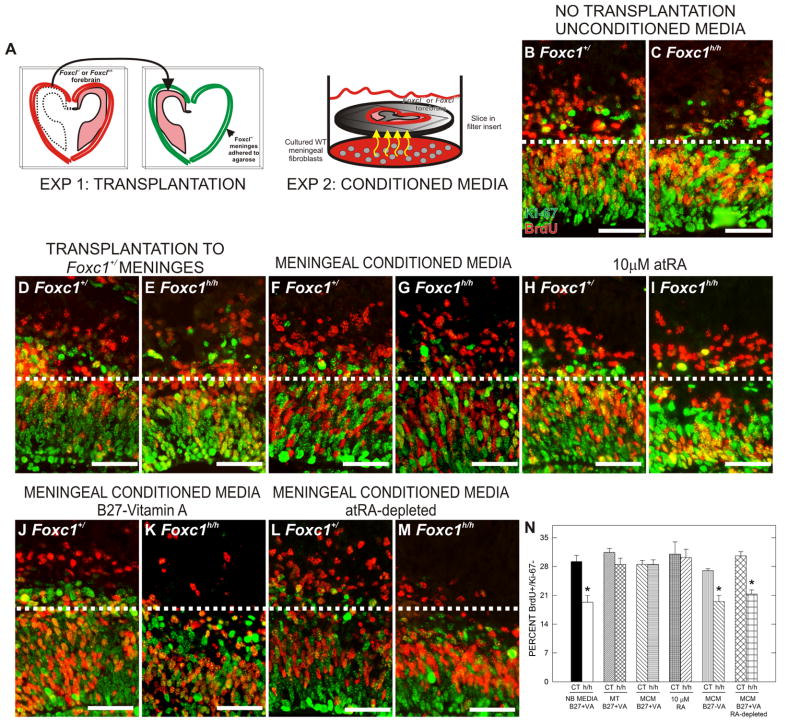
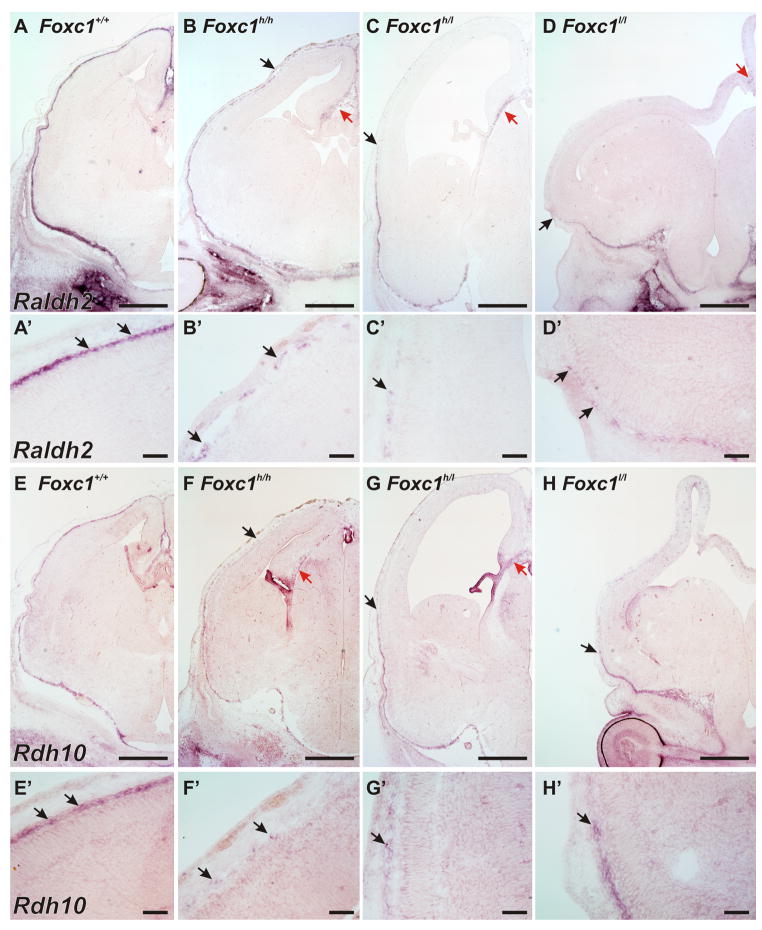
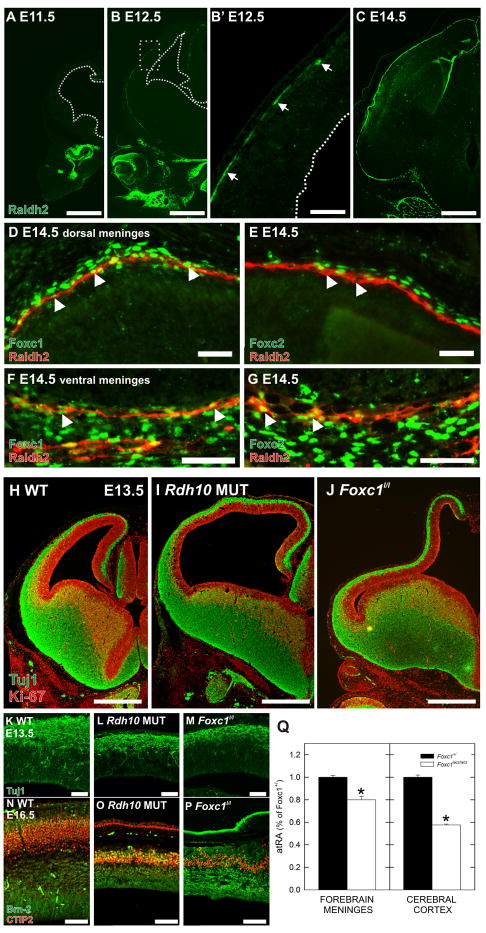
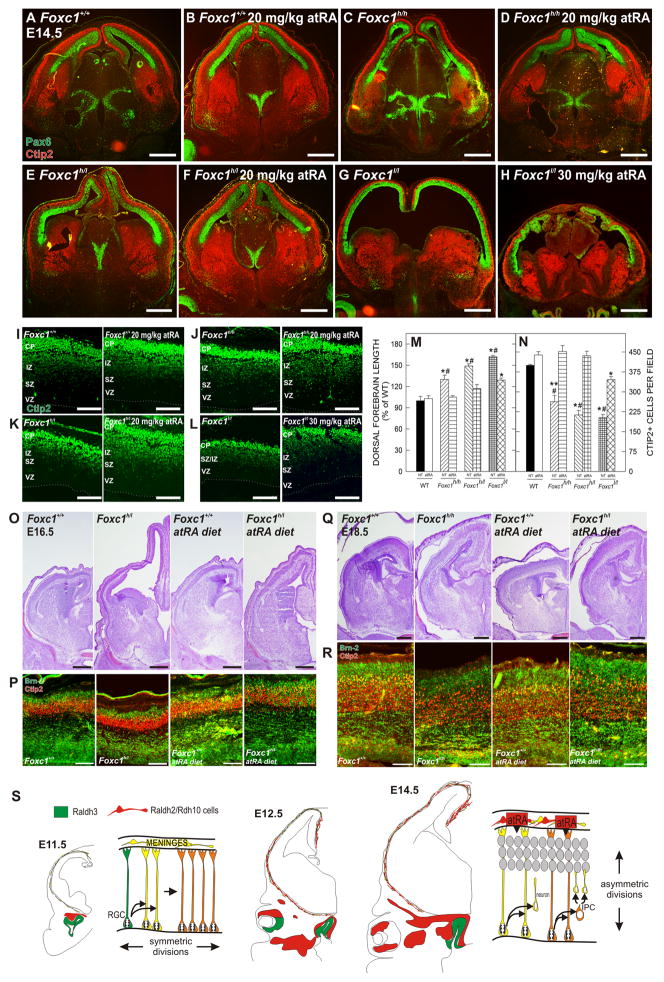
Extrinsic signals controlling generation of neocortical neurons during embryonic life have been difficult to identify. In this study we demonstrate that the dorsal forebrain meninges communicate with the adjacent radial glial endfeet and influence cortical development. We took advantage of Foxc1 mutant mice with defects in forebrain meningeal formation. Foxc1 dosage and loss of meninges correlated with a dramatic reduction in both neuron and intermediate progenitor production and elongation of the neuroepithelium. Several types of experiments demonstrate that retinoic acid (RA) is the key component of this secreted activity. In addition, Rdh10- and Raldh2-expressing cells in the dorsal meninges were either reduced or absent in the Foxc1 mutants, and Rdh10 mutants had a cortical phenotype similar to the Foxc1 null mutants. Lastly, in utero RA treatment rescued the cortical phenotype in Foxc1 mutants. These results establish RA as a potent, meningeal-derived cue required for successful corticogenesis.


Figures

Figure 1
Figure 1
Foxc1 gene dosage correlates with severity of dorsal forebrain phenotype (A) E14.5 Foxc1+/+, Foxc1h/h, Foxc1h/l, and Foxc1l/l forebrains labeled with Tuj1 (green) and Ki-67 (red). (B) Quantification of the dorsal forebrain length in WT and Foxc1h/h, Foxc1h/l, and Foxc1l/l brains. (C) Nissl stains of E18.5 Foxc1h/h, Foxc1 h/l and Foxc1l/l mutant brains. Arrows indicate cortical dysplasia. Scale bars = (A) 500 μm and (C) 1 mm. * and # denote statistically significance (p<0.05) from WT and Foxc1h/h, respectively.
Figure 2
Figure 2
Defect in switch from symmetric to asymmetric divisions in the neuroepithelium of Foxc1 mutants (A) aPKCλ immunostaining in WT, Foxc1h/h, Foxc1h/l, and Foxc1l/l cortical neuroepithelium at E14.5. (B) Par3 immunostaining (green) in the apical membrane of E14.5 WT, Foxc1h/h, Foxc1h/l, and Foxc1l/l cortical neuroepithelial cells with (right panels) and without (left panels) DAPI nuclear stain (blue). (C) Quantification of fluorescent intensities of aPKCλ (top) and Par3 (bottom) in WT and Foxc1 mutants. (D–H) Representative staining from BrdU (red)/Ki-67 (green) cell cycle exit assay; dotted line demarcates BrdU+/Ki-67- cells in the IZ of WT (D) Foxc1h/h (E), Foxc1h/l (F) and Foxc1l/l (G) cortices. The percentage of exited cells was quantified for WT and Foxc1 mutants (H). (I–M) Tbr2 immunostaining of IPCs in the VZ and SVZ of WT (I), Foxc1 h/h (J), Foxc1 h/l (K), and Foxc1l/l (L) cortices. Quantification of Tbr2+ cells in all genotypes (M). (N–Q) Ctip2 (green) in E14.5 (N) WT, (O) Foxc1 h/h, (P) Foxc1h/l, and (Q) Foxc1l/l mutants. Dotted line denotes ventricular surface. (R–U) Brn2 (green) and Ctip2 (red) co-labeling in E18.5 (R) WT, (S) Foxc1 h/h, (T) Foxc1 h/l, and (U) Foxc1l/l mutants. Scale bars = (A–B) 25 μm, (D–G, I–L) 100 μm, and (N–U) 200 μm. * and ** denote a statistically significant difference (p<0.05) from WT and both WT and Foxc1h/h, respectively. Abbreviations: (CP) cortical plate; (IZ) intermediate zone; (SVZ) subventricular zone; (VZ) ventricular zone.
Figure 3
Figure 3
The dorsal forebrain meninges fail to form completely in the Foxc1 mutants (A–D) Low (A–D) and high-magnification images (A′-D′) of Zic immunostaining in WT, Foxc1h/h, Foxc1h/l (C), and Foxc1l/l E14.5 heads. Arrowheads in A′ indicate Zic+ Cajal-Retzius cells and open arrows in A′ indicate Zic+ cells in the cortical vasculature. The endpoint of the meninges (denoted by an asterisk in B, C, & D) is shown in higher magnification view in B′, C′ & D′ and indicated by a dotted line. Lightly labeled Zic+ vascular cells persist in the residual mesenchyme in all mutants (open arrows in B′). (E–F) Low (E & F) and high (E′ & F′) magnification images of x-gal staining in E14.5 Foxc1+/l and Foxc1l/l. Higher magnification images show lightly-labeled β-gal+ cells in the cortical vasculature (E′ & F′; arrows). Scale bars = (A–D & E, F) 500 μm and (A′-D′ & E′, F′) 100 μm.
Figure 4
Figure 4
Cell cycle exit defect in Foxc1h/h explants is rescued by exposure to secreted cues from meninges and atRA (A) Depiction of in vitro explant preparations: meningeal transplantation preparation (left diagram) and co-culturing of Foxc1h/h mutant explants in media conditioned by WT meninges (right diagram). (B–M) BrdU (red) and Ki-67 (green) double-immunolabeling of Foxc1+/ and Foxc1h/h forebrain explants from the following treatment conditions: untreated Neurobasal media (NB) (B, C), meningeal transplantation (MT) (D, E), meningeal conditioned media (MCM) (F, G), atRA (H, I), MCM containing B27-VA supplement (J, K), and atRA-depleted MCM (L, M). Dotted line demarcates transition from proliferative and post-mitotic zones in the cerebral wall. Unless noted otherwise, all media contained B27+VA supplement. (N) Quantification of the percent BrdU+/Ki-67- in each explant treatment condition. Scale bars = 50 μm. * indicates statistically significance from untreated Foxc1+/ explants (p<0.05).
Figure 5
Figure 5
Expression of Raldh2 and Rdh10 in WT and Foxc1 mutant meninges (A–D) Low (A–D) and high (A′-D′) magnification images of in situ hybridization for Raldh2 on E14.5 WT and Foxc1 mutant heads. The endpoint of meningeal Raldh2 signal is indicated by an arrow in B, C, & D. Red arrow in B, C, & D indicates Raldh2 signal in the midline correlating to residual meninges. (E–H) Low (E–H) and high (E′-H′) magnification images of in situ hybridization for Rdh10 on E14.5 WT and Foxc1 mutant heads. The arrows in F, G, & H indicate the end of Rdh10 signal in the Foxc1 mutants and (magnified in F′-H′). Red arrows in F & G indicate Rdh10 signal in the cortical hem and choroid plexus of Foxc1h/h, and Foxc1h/l animals; it is not seen in the hem and choroid plexus of H as these structures are not present in the Foxc1l/l at this level. Scale bars = 50 μm (A′–H′), 500 μm (A–H). Arrows in A′-H′ indicate cells with positive signal.
Figure 6
Figure 6
Raldh2 expression in the developing meninges and phenotype of Rdh10 mutant (A–C) Raldh2 (green) expression at E11.5 (A), E12.5 (B), and (C) E14.5. Higher magnification of the box in B shows the leading edge of Raldh2 in the meninges (B′; arrows). (D–G) High magnification image of dorsal WT meninges at E14.5 showing expression of Foxc1 (green) in the nucleus of Raldh2 (red) expressing cells (D; arrows). Foxc2 is expressed in meningeal cells above the Raldh2 cell layer but Raldh2+ cells in this area are not Foxc2+ (E; arrows). In the ventral meninges, Raldh2+ cells express both Foxc1 (F; arrows) and Foxc2 (G; arrows). (H–J) Tuj1 (green) and Ki-67 (red) double immunolabeling of E13.5 WT (H), Rdh10 mutant (I), and Foxc1l/l (J) brains highlights the similarities in the dorsal forebrain phenotype in the two mutants. (K–P) High magnification images of Tuj1 (green; K–M) or dual Ctip2 (red) and Brn-2 (green; N–P) immunolabeling in E13.5 and E16.5 WT (K, N) Rdh10 mutant (L, O) and Foxc1l/l mutant (M, P). (Q) Graph depicting atRA levels in the total forebrain meninges and cortices of Foxc1+/ and Foxc1l/l embryos at E14.5. Values are reported as percent of atRA in Foxc1+/ tissue. Scale bars = (D–E, K–M) 50 μm (N–P) 100 μm (F–G) 200 μm, (A–C, H–J) 500 μm. * indicates statistically significance from Foxc1+/ (p<0.05).
Figure 7
Figure 7
In vivo rescue of Foxc1 forebrain phenotype by atRA (A–H) Ctip2 (green) and Pax6 (red) immunostaining on E14.5 untreated (A, C, E, & G) and atRA-treated (B, D, F, & H) WT and Foxc1 mutants. (I–L) Ctip2 immunostaining in untreated and atRA-treated WT (I), Foxc1h/h (J), Foxc1h/l (K), and Foxc1l/l (L) at E14.5. Dotted line indicates ventricular surface. (M) Quantification of the dorsal forebrain length; values are a percentage of the mean length of untreated WT. (N) Quantification of Ctip2+ cells in untreated and atRA-treated WT and Foxc1 mutant cortices. (O–P) Nissl stained E16.5 brains from untreated WT and Foxc1h/l and embryos exposed to an atRA diet (O). Adjacent sections immunolabeled for Ctip2 (red) and Brn-2 (green) (P). (Q–R) Nissl staining (Q) and Ctip2 (red) and Brn-2 (green) immunolabeling (R) from untreated and atRA diet E18.5 WT and Foxc1h/h brains. (S) Schematic of cortical neuroepithelial divisions prior to (E11.5) and after (E14.5) the arrival of Raldh2/Rdh10-expressing cells (red cells) in the meninges. Scale bars= (A–H, O, Q) 500 μm and (I–L, P, R) 100 μm. *#, *, and **# indicates statistical significance (p<0.05) from both untreated/atRA treated WT and atRA-treated Foxc1 mutants, untreated/atRA treated WT, and untreated Foxc1h/l and Foxc1l/l, respectively.

Similar articles

Cited by

References

    1. Anchan RM, Drake DP, Haines CF, Gerwe EA, LaMantia AS. Disruption of local retinoid-mediated gene expression accompanies abnormal development in the mammalian olfactory pathway. J Comp Neurol. 1997;379:171–184. - PubMed
    1. Balkan W, Colbert M, Bock C, Linney E. Transgenic indicator mice for studying activated retinoic acid receptors during development. Proc Natl Acad Sci U S A. 1992;89:3347–3351. - PMC - PubMed
    1. Borrell V, Marin O. Meninges control tangential migration of hem-derived Cajal-Retzius cells via CXCL12/CXCR4 signaling. Nat Neurosci. 2006;9:1284–1293. - PubMed
    1. Caviness VS, Jr, Takahashi T, Nowakowski RS. Numbers, time and neocortical neuronogenesis: a general developmental and evolutionary model. Trends Neurosci. 1995;18:379–383. - PubMed
    1. Chambon P. A decade of molecular biology of retinoic acid receptors. FASEB J. 1996;10:940–954. - PubMed

Publication types

LinkOut - more resources