. 2009 Nov 20;31(5):787-98.
doi: 10.1016/j.immuni.2009.09.014. Epub 2009 Oct 29.

T helper 17 cells promote cytotoxic T cell activation in tumor immunity

Affiliations

T helper 17 cells promote cytotoxic T cell activation in tumor immunity

Natalia Martin-Orozco et al. Immunity. .

Abstract

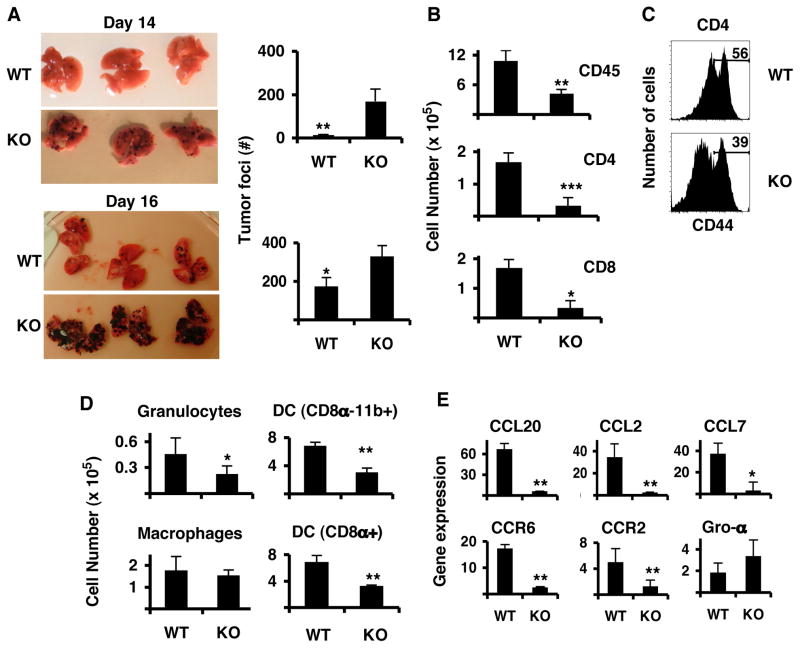
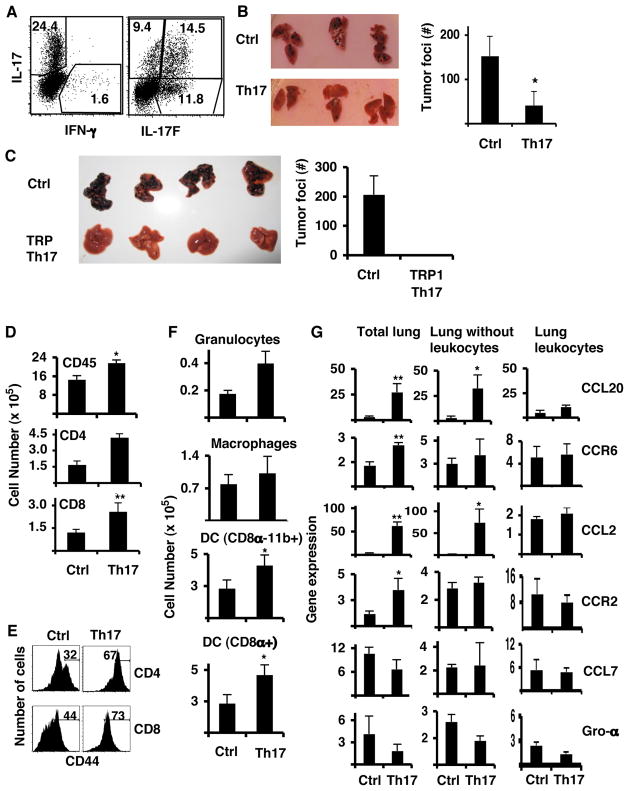
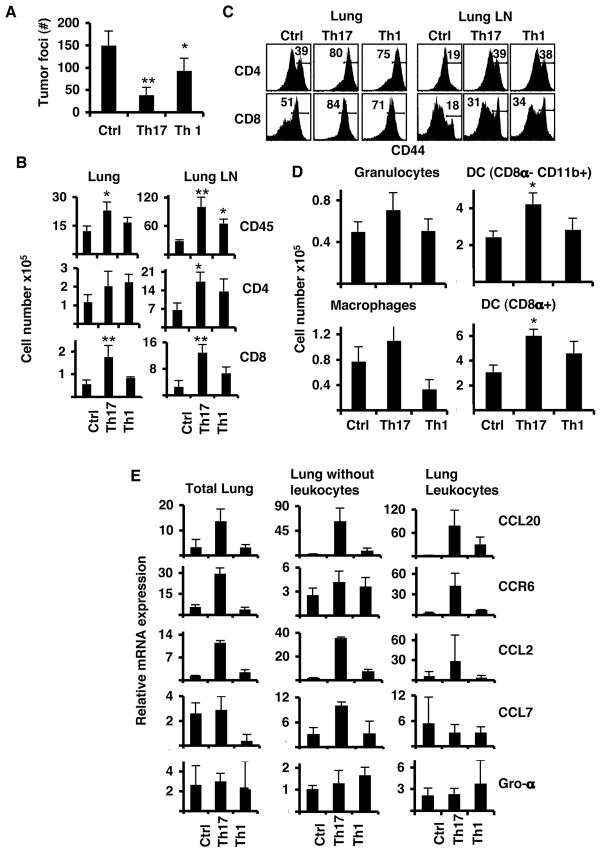
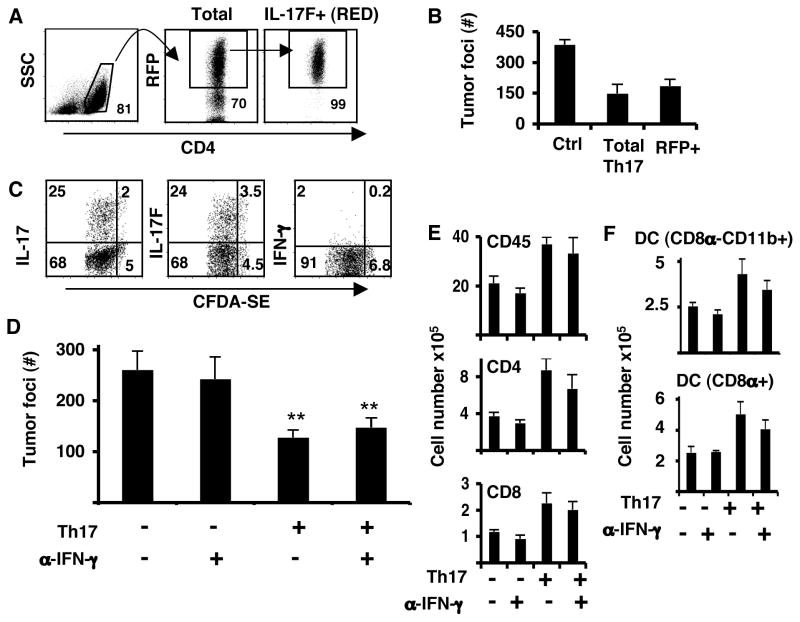
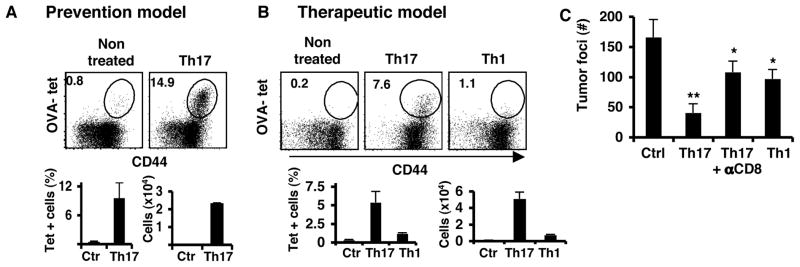
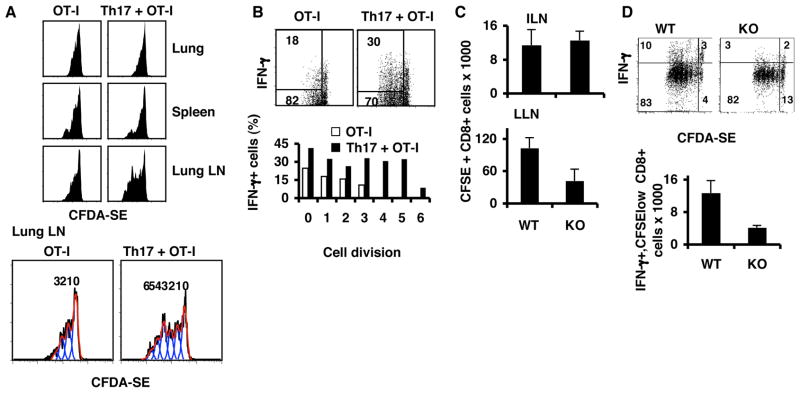
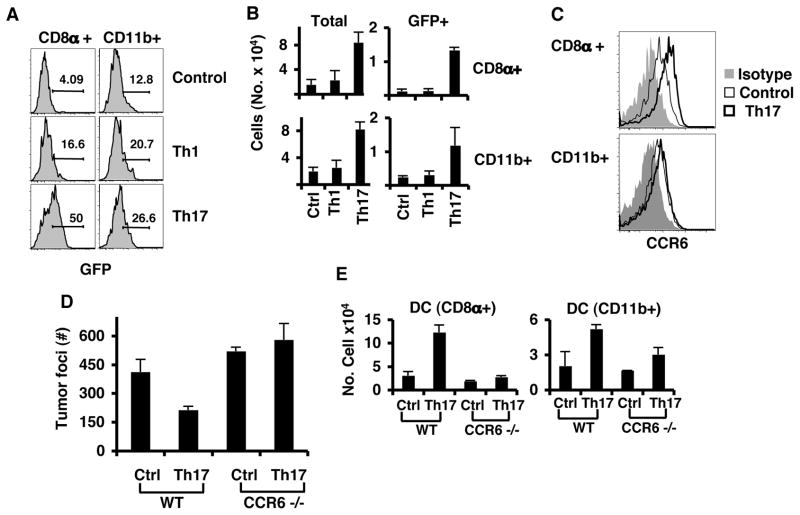
Although T helper 17 (Th17) cells have been found in tumor tissues, their function in cancer immunity is unclear. We found that interleukin-17A (IL-17A)-deficient mice were more susceptible to developing lung melanoma. Conversely, adoptive T cell therapy with tumor-specific Th17 cells prevented tumor development. Importantly, the Th17 cells retained their cytokine signature and exhibited stronger therapeutic efficacy than Th1 cells. Unexpectedly, therapy using Th17 cells elicited a remarkable activation of tumor-specific CD8(+) T cells, which were necessary for the antitumor effect. Th17 cells promoted dendritic cell recruitment into the tumor tissues and in draining lymph nodes increased CD8 alpha(+) dendritic cells containing tumor material. Moreover, Th17 cells promoted CCL20 chemokine production by tumor tissues, and tumor-bearing CCR6-deficient mice did not respond to Th17 cell therapy. Thus, Th17 cells elicited a protective inflammation that promotes the activation of tumor-specific CD8(+) T cells. These findings have important implications in antitumor immunotherapies.


Figures

Figure 1
Figure 1. IL-17-deficient mice are more susceptible to B16/F10 melanoma development in the lung
IL-17−/− (KO) and wild-type (WT) mice were challenged i.v. with B16/F10 melanoma and lungs were analyzed on days 14 and day 16. A. Photographs of the lungs. Graphs on the right show total number of tumor colonies present in the lung lobes (n=4, avg. +/− s.d). B–E. At day 16, lung leukocyte and lung cell fractions were isolated and processed for FACS analysis or RNA extraction. B. Total leukocyte cell numbers from lungs. The numbers were calculated from the percentages of total live cells that were gated on CD45+ cells (n=4, avg. +/− s.d.). C. Expression of CD44 on CD45+CD4+ T cells from the leukocyte fraction. D. Myeloid populations (n=4, avg. +/− s.d). E. Chemokine and chemokine receptor gene expression analyses from lung fractions, which were free of leukocytes. Shown are the averages of 4 mice after duplicate analysis per sample (n=4, avg. +/− s.d). Results shown are from a representative experiment of three, each using 4–5 mice per group.
Figure 2
Figure 2. Anti-tumor Th17 cells prevent B16/F10 melanoma development
A. Cytokine profiles of CD45.1+ OT-II cells polarized to Th17 that were used for the transfer. B,D,E and F. C57BL/6 mice were injected i.v. with 1×10⁵ B16-OVA cells and 5 million OT-II Th17 cells. B. Photographs of lungs from untreated control mice (Ctrl) and mice treated with Th17 cells (Th17). The graph shows the average of tumor colony numbers from 5 mice (avg. +/− s.d.). C. C57BL/6 mice were injected i.v. with 1×10⁵ B16/F10 cells and 5 million of TRP-1 Th17 cells. Shown are photographs of the lungs and the numbers of colonies in the lung (n=5, avg.+/− s.d). D. Numbers of total CD45+, or CD4+ or CD8+ T cells (n=5, avg. +/− s.d.) from the leukocyte fraction. E. Expression of CD44 on gated CD45.2+ CD4+ (upper panel) or CD45.2+ CD8+ T cells (lower panel). Numbers represent the percentages of CD44hi cells. F. Numbers of myeloid cell populations from leukocyte lung fraction were calculated from the percentages of live cells gated on CD45.2+CD11c+ CD11b+ (n=5, avg. +/− s.d.). G. Gene expression analysis of total lung derived cells with leukocytes, lung cells with tumor cells and no leukocytes and leukocyte fractions. Graphs represent the average values of four mice after duplicate analysis per sample (n=4, avg. +/− s.d). (* = p <0.05, ** = p< 0.01). Results shown are from one representative experiment of three using 4–5 mice per group.
Figure 3
Figure 3. Anti-tumor Th17 cells control established B16/F10 melanoma
A. Mice were inoculated i.v. with B16-OVA and on day 5, these mice received 3×10⁶ Th1 or Th17 cells i.v. Mice were euthanized on day 14 after tumor challenge for analysis. Shown are the tumor colonies present in the lung lobes of each group of mice (n=4, avg. +/− s.d). B. Cell numbers from leukocyte lung fractions of each group of mice, Control (Ctr), Th1 and Th17, were calculated from the percentages of live cells gated on CD45.2 (n=4, avg. +/− s.d). C. Expression of CD44 on T cells obtained from the lung leukocyte fraction (Lung) or from lung lymph nodes (Lung LN). Cells were gated on CD45.2 and CD4 (middle panel) or CD8 (lower panel). Numbers represent the percentages of CD44hi cells. D. Total numbers of myeloid cell populations from leukocyte lung fraction. Numbers of cells were calculated from the percentages of live cells gated on CD45.2 (n=4, avg. +/− s.d.). E. Gene expression analysis of total lung derived cells with leukocytes and leukocyte fractions. Graphs represent the average values of four mice after duplicate analysis per sample (n=4, avg. +/− s.d). Results shown are from one representative experiment of three using 4–5 mice per group. (* = p< 0.05, ** = p< 0.01).
Figure 4
Figure 4. Th17 cells maintain their cytokine expression in tumor-bearing mice
Purified CD4+ T cells from OT-II.IL-17F-RFP reporter mice were cultured in Th17 conditions. On day 4, CD4+RFP+ cells were sorted and injected into C57BL/6 mice bearing 5-day established pulmonary B16-OVA tumors. A. Sorting strategy for RFP+, IL-17F producing cells. B. Tumor foci from lungs of C57BL/6 mice that had B16-OVA melanoma and received either no treatment (C), unsorted Th17 (total Th17) or RFP+ sorted (IL17F+ RED). C. Purified CD4+ T cells from Rag1−/− OT-II mice were cultured in Th17 conditions and on day 4, cells were labeled with CFDA-SE and transferred into C57BL/6 mice bearing 5-day established pulmonary B16-OVA tumors. LLN from these mice were analyzed for proliferation and IL-17, IL-17F and IFN-γ production on day 4 after transfer. D. Mice were inoculated with B16-OVA tumor and received on the same day Th17 (Th17) cells i.v or no T cells. A set of mice from each group was treated with anti-IFN-γ blocking antibodies (α-IFN-γ) on day -1 and every other day until day 14 after tumor challenge. Shown are the tumor colonies present in the lung lobes of each group of mice (n=4, avg. +/− s.d). (**P<0.01). E. Total cell numbers from leukocyte lung fractions. Number were calculated from the percentages of live cells gated on CD45.2 (n=4, avg. +/− s.d). F. Number of myeloid cell populations from leukocyte lung fraction was calculated from the percentage of live cells gated on CD45.2 (n=4, avg. +/− s.d.).
Figure 5
Figure 5. Th17 cells elicit tumor-specific CD8+ T cell responses
A–B. Dot plots show the frequencies of OVA tetramer-staining (Kb-SIINFEKL) cells in CD45.2+ CD8+ gated T cells obtained from the leukocyte fraction in mice that received either preventive or therapeutic treatment with Th17 cells. Lower graphs represent total number of cells from the average of 4 mice per group. C. Mice were inoculated i.v. with B16-OVA and on day 5 mice received either PBS or 3×10⁶ of Th1 or Th17 OT-II cells i.v. Depleting antibodies against CD8 were administered i.p on day 4 after the tumor inoculation and every 4 days until the endpoint. Shown are the average numbers of tumor colonies present in the lung lobes of each group of mice (n=4, avg. +/− s.d). (**p<0.01, * p<0.05).
Figure 6
Figure 6. Th17 T cell treatment promotes CD8+ effector T cell differentiation
A–B. Purified CD8+ T cells from OT-I mice were labeled with CFDA-SE and transferred into C57BL/6 mice bearing 5-day established pulmonary B16 nodules (OT-I). On the day of the transfer, one group of mice also received OT-II Th17 (OT-I+ Th17). On day 3 after transfer, LLN, lungs and spleens from these mice were analyzed for T cell proliferation, IFN-γ and IL-2 production. A. Histograms show cell division. Numbers in the lower panel indicates numbers of division. B. Cytokine production. Numbers inside the plots represent the percentages of dividing OT-I cells that also produced the cytokine. Bar graphs indicate the percentages of cells that produced cytokines per cell division. C–D. CD8+ T cells from OT-I mice were labeled with CFDA-SE and transferred into C57BL/6 mice or IL17−/− (KO) bearing 5-day established pulmonary B16-OVA. LLN and inguinal lymph node (ILN) cells from these mice were analyzed for proliferation and cytokine production on day 4 after transfer. C. Total numbers of CD8+CFSE+ T cells recovered from ILN and LLN. D. Cytokine profiles of CD8+ CFSE+ T cells from LLN. E. Total number of CD8+CFSElow IFN-γ+ T cells recovered from LLN.
Figure 7
Figure 7. Characterization of DCs from LN of mice treated with Th17 cells
A. C57BL/6 mice were injected i.v. with B16/F10 cells expressing OVA-GFP together with Th1 or Th17 OT-II cells. LLNs were harvested on day 3 for DC analysis by flow cytometry. Histograms show gated CD11bhi CD11c+ (CD11b+) and CD11bint CD11c+ CD8α+ (CD8α+) DCs. B. Lung lymph node cells from A were counted, and total number of cells per DC population calculated from live gate, CD11c, CD11b (TOTAL) or live gate, CD11c, CD11b and GFP (GFP). C. C57BL/6 mice were injected i.v. with B16-OVA and Th17 OT-II cells. LLN were harvested on day 16 for DC analysis. Cells were labeled with antibodies against CCR6 or Isotype Rat IgG. Shown are overlay histograms of either CD8α+ DC or CD11b+ cells. Rat IgG (gray filled histograms), CCR6 from control mice (thin line) and mice that were treated with Th17 cells (bold line). D. C57BL/6 mice or CCR6-deficient mice (CCR6−/−) were injected i.v. with B16-OVA and Th17 OT-II cells. Graph shows the average number of tumor colonies from lung lobes from WT (n=5) and KO (n=3) mice (avg. +/− s.d). E. LLN cells from D were analyzed for DC populations. Graphs show the total number of cells from WT (n=5) and KO (n=3) mice (avg. +/− s.d).

Comment in

Similar articles

Cited by

References

    1. Benchetrit F, Ciree A, Vives V, Warnier G, Gey A, Sautes-Fridman C, Fossiez F, Haicheur N, Fridman WH, Tartour E. Interleukin-17 inhibits tumor cell growth by means of a T-cell-dependent mechanism. Blood. 2002;99:2114–2121. - PubMed
    1. Chang SH, Dong C. A novel heterodimeric cytokine consisting of IL-17 and IL-17F regulates inflammatory responses. Cell Res. 2007;17:435–440. - PubMed
    1. Chang SH, Park H, Dong C. Act1 adaptor protein is an immediate and essential signaling component of interleukin-17 receptor. J Biol Chem. 2006;281:35603–35607. - PubMed
    1. Chung Y, Chang SH, Martinez GJ, Yang XO, Nurieva R, Kang HS, Ma L, Watowich SS, Jetten AM, Tian Q, Dong C. Critical regulation of early Th17 cell differentiation by interleukin-1 signaling. Immunity. 2009;30:576–587. - PMC - PubMed
    1. Chung Y, Yang X, Chang SH, Ma L, Tian Q, Dong C. Expression and regulation of IL-22 in the IL-17-producing CD4+ T lymphocytes. Cell Res. 2006;16:902–907. - PubMed

Publication types