. 2010 Jan 1;285(1):731-40.
doi: 10.1074/jbc.M109.052548. Epub 2009 Oct 28.

Differential regulation of TRPV1, TRPV3, and TRPV4 sensitivity through a conserved binding site on the ankyrin repeat domain

Affiliations

Differential regulation of TRPV1, TRPV3, and TRPV4 sensitivity through a conserved binding site on the ankyrin repeat domain

Christopher B Phelps et al. J Biol Chem. .

Abstract

Transient receptor potential vanilloid (TRPV) channels, which include the thermosensitive TRPV1-V4, have large cytoplasmic regions flanking the transmembrane domain, including an N-terminal ankyrin repeat domain. We show that a multiligand binding site for ATP and calmodulin previously identified in the TRPV1 ankyrin repeat domain is conserved in TRPV3 and TRPV4, but not TRPV2. Accordingly, TRPV2 is insensitive to intracellular ATP, while, as previously observed with TRPV1, a sensitizing effect of ATP on TRPV4 required an intact binding site. In contrast, ATP reduced TRPV3 sensitivity and potentiation by repeated agonist stimulations. Thus, ATP and calmodulin, acting through this conserved binding site, are key players in generating the different sensitivity and adaptation profiles of TRPV1, TRPV3, and TRPV4. Our results suggest that competing interactions of ATP and calmodulin influence channel sensitivity to fluctuations in calcium concentration and perhaps even metabolic state. Different feedback mechanisms likely arose because of the different physiological stimuli or temperature thresholds of these channels.


Figures
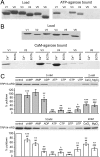
FIGURE 1.
FIGURE 1.
Interactions of TRPV ARDs with ATP and CaM. A, Coomassie-stained gel of an ATP-agarose pulldown assay with the six TRPV ARDs, showing loaded (left) and ATP-agarose-bound (right) proteins. B, Coomassie-stained gels of a CaM-agarose pulldown assay of the six TRPV ARDs showing loaded protein (top) and protein bound in the presence of Ca2+ or EGTA (bottom). C, nucleotide specificity of the TRPV3- and TRPV4-ARD. Coomassie-stained gels of wild type TRPV3-ARD (top) or TRPV4-ARD (bottom) bound to ATP-agarose in the presence of the indicated concentration of competing compounds. The histogram below each representative gel shows the average amount of protein recovered (±S.D.) in the absence or presence of nucleotide and divalent cations over four experiments. The statistical significance with respect to control (#, p < 0.05; ##, p < 0.01; ###, p < 0.001) and ATP (*, p < 0.05; **, p < 0.01; ***, p < 0.001) was determined using two-tailed t tests.
FIGURE 2.
FIGURE 2.
A conserved ATP/CaM binding site in the ARDs of TRPV1, TRPV3, and TRPV4. A, The amino acid conservation between these three ARDs was calculated and mapped onto the surface of the TRPV1-ARD structure (Protein Data Bank code 2PNN) using Consurf (44) based on the alignment in supplemental Fig. 1. The most conserved and divergent residues are purple and cyan, respectively. The ATP binding site is magnified to show the amino acid side chains that contact ATP. The identity of the TRPV1 site and corresponding residues in the other five TRPVs is shown on the right. B, Coomassie-stained gels of wild type and mutant TRPV3-ARD (top) or TRPV4-ARD (bottom) loaded (left) and bound to ATP-agarose in the absence (middle) or presence (right) of competing free ATP. C, Coomassie-stained gels show wild type and mutant TRPV3-ARD (top) or TRPV4-ARD (bottom) loaded (left) and bound to CaM-agarose in the presence of Ca2+ or EGTA. In B and C, the average percentage of protein recovered (±S.D.) is plotted below. The statistical significance of the reduction in binding to ATP-agarose or Ca2+-CaM-agarose with respect to wild type (WT) was determined by one-tailed t tests, with p < 0.05 and p < 0.01 indicated by * and **, respectively.
FIGURE 3.
FIGURE 3.
TRPV2 is insensitive to intracellular ATP. A, sample whole cell patch clamp recordings from TRPV2 expressing HEK293 cells with (right) and without (left) 4 mm ATP in the intracellular solution. Currents at +80 mV (gray) and −80 mV (black) were extracted from linear voltage ramps. Gray bars indicate perfusion with 0.4 mm 2-APB, and black lines indicate zero current. B, average maximum current density evoked during the first 2-APB application. B, TRPV2 does not undergo tachyphylaxis. Currents evoked by multiple 2-APB applications at ±80 mV were normalized to the maximum current from the first 2-APB application. For both B and C, control cells (n = 6) are colored gray and cells with intracellular solution supplemented with 4 mm ATP are colored white (n = 6).
FIGURE 4.
FIGURE 4.
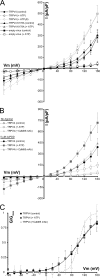
TRPV4 is sensitized by intracellular ATP. A, average current density from voltage step experiments in insect cells plotted against holding potential for cells recorded in the absence (solid symbols) or presence of intracellular ATP (black, open symbols) or ATPγS (gray, open symbols). Data from control cells infected with empty virus (n = 4 each; squares), wild type (WT) TRPV4 data (n = 7 each; circles), and TRPV4 K178A data (n = 7 each; triangles) are shown. ATP and ATPγS cause a significant current increase (p < 0.05 at Vm > 100 mV). B, average current density plotted against holding potential from voltage step experiments in TRPV4-expressing HEK293 cells. Data were collected on unstimulated (open symbols) and 4αPDD-perfused cells (5 μm; filled symbols) with control intracellular solution (black circles, n = 6), 4 mm ATP (dark gray squares, n = 7) or an anti-CaM monoclonal antibody (CaM85, light gray triangles, n = 6). C, activation curves from TRPV4-expressing HEK293 cells calculated from the average, normalized tail currents measured in the first milliseconds after a step to −160 mV from the cells in B (control, black circles; ATP, dark gray squares; CaM85 mAb, light gray triangles). Lines represent the fit of a modified Boltzmann function to the data.
FIGURE 5.
FIGURE 5.
Sensitization of TRPV3 in insect cells. A, sample whole cell patch clamp recordings from baculovirus-infected insect cells expressing wild type TRPV3. Shown are currents at +100 (gray circles) or −100 mV (black circles) extracted from linear voltage ramps from a control cell (top) and cells with intracellular ATP (bottom). Applications of 0.25 mm 2-APB are indicated by gray bars and zero current by black lines. For the control cell the dashed lines indicate the time points for the I–V traces (plotted as current density versus membrane voltage) from type 1 (I1) and off-response type 2 (I2) currents, which are shown below the control. B, control cells are sensitized by repeat applications of 2-APB, and this is blocked by ATP and ATPγS. Average current densities (pA/pF) at +100 and −100 mV are shown for the first, sixth, and twelfth applications of 2-APB to TRPV3-expressing cells with intracellular solutions containing no nucleotide (control; black bars, n = 9), ATP (white, n = 6) or ATPγS (gray, n = 7). C, sample whole cell recordings from insect cells expressing wild type TRPV3 with BAPTA as the intracellular calcium buffer (top) and TRPV3 K169A with EGTA as the intracellular calcium buffer (bottom) collected and displayed as in A. D, average maximum current density at +100 and −100 mV from a 30 s application of 0.25 mm 2-APB for wild type (WT) TRPV3 with EGTA (black bars) or BAPTA (dark gray bars), and K169A TRPV3 with EGTA (gray bars). Note that C and D are on the same scales as A and B, respectively.
FIGURE 6.
FIGURE 6.
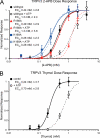
ATP lowers the sensitivity of TRPV3 to chemical agonists. A, dose response of TRPV3 to 2-APB. The dose response of wild type (black circles), R188A (red triangles), and K169A (blue squares) TRPV3 to 2-APB were determined from control cells (filled symbols) and cells with intracellular ATP (open symbols). Normalized responses (based on the average maximum current density at −100mV) are plotted against the concentration of 2-APB. Fits of the data to the Hill equation are shown as solid (control cells) or dashed lines (+ ATP), and the resulting EC50 and Hill coefficients (n) values are listed for each sample. B, dose response of wild type TRPV3 currents to thymol, measured as in A, showing control cells (filled circles; solid line) and cells with intracellular ATP (open circles; dashed line).
FIGURE 7.
FIGURE 7.
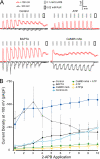
Ca2+-CaM and ATP decrease the sensitivity of TRPV3 in HEK293 cells. A, sample whole cell patch clamp recordings from transiently transfected HEK293 cells expressing wild type TRPV3. Shown are currents at +100 (red circles) or −100 mV (black circles) extracted from linear voltage ramps from cells with different intracellular solutions; control (top left), 4 mm ATP (top right), 10 mm BAPTA (lower left), and 2 μg/ml anti-CaM antibody (Ab) (CaM85, lower right). Application of 0.1 mm 2-APB to the cells is shown by gray bars. White bars indicate application of 20 μm ruthenium red (RuR), a channel blocker. B, average current density at −100 mV (in pA/pF or picoampere per picofarad) from 10 consecutive applications of 2-APB for cells with control intracellular solution (black diamonds), 10 mm BAPTA (gray triangles), CaM85 monoclonal antibody (mAb; dark blue circles), isotype matched control antibody (light blue circles), ATP (yellow squares), ATPγS (open yellow squares), and both ATP and CaM85 monoclonal antibody (green circles).
FIGURE 8.
FIGURE 8.
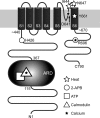
Topology of TRPV3 and location of functionally important sites. The ARD is important in the tuning of TRPV3 sensitivity and interacts with ATP (square) and Ca2+-CaM (starred triangle; see also Ref. 21). The previously identified sites of heat activation (Ile644, Asn647, and Tyr661 marked as white stars; Ref. 42), activation by 2-APB (cytoplasmic residues His426 and Arg696, circles; Ref. 43), and calcium sensitivity (intracellular site Arg696; Ref. 42) and extracellular site Asp641; Ref. 21) are also indicated.

Similar articles

Cited by

References

    1. Venkatachalam K., Montell C. (2007) Annu. Rev. Biochem. 76, 387–417 - PMC - PubMed
    1. Nijenhuis T., Hoenderop J. G., Bindels R. J. (2005) Pflugers Arch. 451, 181–192 - PubMed
    1. Caterina M. J. (2007) Am. J. Physiol. Regul. Integr. Comp. Physiol. 292, R64–R76 - PubMed
    1. Tominaga M., Caterina M. J. (2004) J. Neurobiol. 61, 3–12 - PubMed
    1. Xu H., Delling M., Jun J. C., Clapham D. E. (2006) Nat. Neurosci. 9, 628–635 - PubMed

Publication types

LinkOut - more resources