. 2010 Mar 5;285(10):7176-86.
doi: 10.1074/jbc.M109.047423. Epub 2009 Oct 26.

Generation and accumulation of immunosuppressive adenosine by human CD4+CD25highFOXP3+ regulatory T cells

Affiliations

Generation and accumulation of immunosuppressive adenosine by human CD4+CD25highFOXP3+ regulatory T cells

Magis Mandapathil et al. J Biol Chem. .

Abstract

Naturally occurring regulatory T cells (nTreg) are crucial for maintaining tolerance to self and thus preventing autoimmune diseases and allograft rejections. In cancer, Treg down-regulate antitumor responses by several distinct mechanisms. This study analyzes the role the adenosinergic pathway plays in suppressive activities of human nTreg. Human CD4(+)CD25(high)FOXP3(+) Treg overexpress CD39 and CD73, ectonucleotidases sequentially converting ATP into AMP and adenosine, which then binds to A(2a) receptors on effector T cells, suppressing their functions. CD4(+)CD39(+) and CD4(+)CD25(high) T cells express low levels of adenosine deaminase (ADA), the enzyme responsible for adenosine breakdown, and of CD26, a surface-bound glycoprotein associated with ADA. In contrast, T effector cells are enriched in CD26/ADA but express low levels of CD39 and CD73. Inhibitors of ectonucleotidase activity (e.g. ARL67156) and antagonists of the A(2a) receptor (e.g. ZM241385) blocked Treg-mediated immunosuppression. The inhibition of ADA activity on effector T cells enhanced Treg-mediated immunosuppression. Thus, human nTreg characterized by the presence of CD39 and the low expression of CD26/ADA are responsible for the generation of adenosine, which plays a major role in Treg-mediated immunosuppression. The data suggest that the adenosinergic pathway represents a potential therapeutic target for regulation of immunosuppression in a broad variety of human diseases.


Figures
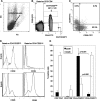
FIGURE 1.
FIGURE 1.
Gating strategy for CD4+CD25high T cells and expression of CD39 or CD26 in human CD4+CD25high cells and CD4+CD25neg cells. A, lymphocytes were identified based on their characteristic properties shown in the forward scatter (FS) and sideward scatter (SS). B, the subset of CD4+CD25high T cells was identified based on the MFI >120 for CD25 expression on CD4+ T cells. C, distribution of CD39 and CD26 in CD3+CD4+ cells. The dot plot shows data for one representative healthy individual. D, CD4+CD25high and CD4+CD25neg T-cell subsets were stained for CD39 and CD26. Histograms show the levels of expression of these markers (bold line) in the gated populations compared with the appropriate isotype control (thin line). Data for one representative donor of 15 tested are shown. E, cells of 15 donors were stained for the surface expression of CD39 and CD26 as described under “Experimental Procedures.” The mean % ± S.D. values of T cells positive for these markers within each subset are shown.
FIGURE 2.
FIGURE 2.
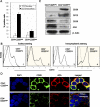
Expression of CD73, CD39, and CD26 on different T-cell subsets. A, CD4+CD25high and CD4+CD25neg subsets of T cells were tested ± permeabilization for expression of CD73 on the cell surface or in the cytoplasm. Flow cytometry data show percentages of positive cells. The data are mean values ± S.D. obtained with cells of 15 normal controls. B, lymphocytes were surface or intracellularly stained for CD73. Histograms show level of expression in the gated populations compared with appropriate isotype controls. Data for one representative individual of 15 tested are shown. C, Western blot analysis of CD39, CD73, CD26, and ADA expression in single cell-sorted CD4+CD25high and CD4+CD25neg cells. Blots show data of one representative individual from at least three experiments performed with cells of different donors. D, multicolor confocal microscopy of single cell-sorted CD4+CD25neg and CD4+CD25high cells shows the simultaneous expression of CD26 and ADA on the surface of CD4+CD25neg T cells. Relatively little expression of these markers is seen in CD4+CD25high Treg.
FIGURE 3.
FIGURE 3.
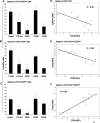
Multiparameter flow cytometry analyses of CD4+CD25high, CD4+CD39+, and CD4+CD26neg Treg subsets. A, phenotypic characteristics of circulating CD4+CD25high T cells. B, phenotypic characteristics of circulating CD4+CD39+ T cells. C, phenotypic characteristics of circulating CD4+CD26neg T cells. The data are mean % ± S.D. from experiments performed with cells of 15 donors. D, correlation of CD25high and CD26 expression of CD3+CD4+ T cells based on the MFI as determined by flow cytometry. E, correlation of the CD39 and CD26 expression (MFI) in CD4+CD25high cells. F, correlation of FOXP3 and CD39 expression based on the MFI in CD3+CD4+CD25high cells.
FIGURE 4.
FIGURE 4.
Suppression mediated by CD4+CD39+ or CD4+CD26neg Treg. MACS-sorted and CFSE-labeled CD4+CD25neg (RC) were co-incubated with either CD4+CD39+ cells or CD4+CD26neg as described under “Experimental Procedures.” Suppression of RC proliferation was measured by flow cytometry and further analyzed by the ModFit program. A, suppression of CD4+CD25neg cell proliferation mediated by CD4+CD39+ cells at various S/RC ratios in comparison with RC co-cultured with CD4+CD39neg cells. B, suppression of proliferation of RC in presence of CD4+CD26neg cells in comparison to the proliferation in co-culture with CD4+CD26+ cells in different S/RC ratios. The data in A and B are mean values ± S.D. obtained in three independent experiments.
FIGURE 5.
FIGURE 5.
Enzymatic activity of the ectonucleotidase CD39 and adenosine production in CD4+CD25+ and CD4+CD25neg cells. A, MACS-sorted CD4+CD25+ and CD4+CD25neg cells were plated in 96-well plates in serum-free medium with either 10 or 50 μm of exogenous ATP for 30 min, and unhydrolyzed ATP was measured. “Standard” represents exogenous ATP in serum-free medium incubated without cells plus endogenous ATP released by lysed cells, which were cultured alone in serum-free medium without the addition of exogenous ATP. Data are mean values ± S.D. obtained in three independent experiments. B, measurement of remaining ATP after CD4+CD25+ cells were incubated with different concentrations of exogenous ATP with or without the addition of ARL67156 (selective ecto-ATPase inhibitor). Data are from one representative experiment of three performed with cells of three different donors. C, CD4+CD25+ or CD4+CD25neg were incubated for various periods of time in the presence of 10 μm ATP. The levels of adenosine were determined in the cell supernatant using mass spectrometry. Data are from one representative experiment of three performed with cells of different donors. D, CD4+CD25+ cells/well were incubated with or without ARL67156 (250 μg/ml, an ectonucleotidase inhibitor) or α,β-methylene-ADP (100 μg/ml, selective CD73 inhibitor). Adenosine production by CD4+CD25+ cells in the absence or presence of the ectonucleotidase inhibitors were assessed using mass spectrometry. Data are from one representative experiment of three performed with cells of different donors.
FIGURE 6.
FIGURE 6.
Suppression of CD4+CD25neg cell proliferation mediated by exogenous adenosine or by CD4+CD39+ S in the presence or absence of various inhibitors. A, CD4+CD25neg cells were CFSE-labeled and incubated with various concentrations of 2-chloroadenosine (CADO) for 5 days (100,000 cells/well). Percentage of suppression was determined by flow cytometry, and the data were analyzed using the ModFit software. The data are mean ± S.D. from three independent experiments. B, CD4+CD25neg cells were co-cultured with CD4+CD39+ Treg (S) at various S/RC ratios in the absence or presence of 250 μm ARL67156 (a specific ectonucleotidase inhibitor). Suppression mediated by S cells was determined by flow cytometry, and the data were analyzed using the ModFit program (p < 0.02). The data are means ± S.D. from three independent experiments performed with cells of different donors. C, percent suppression of proliferation of CFSE-labeled CD4+CD25neg cells co-incubated with CD4+CD39+ cells at the S/RC ratio of 1:1. To selected wells either α,β-methylene-ADP (specific CD73 inhibitor) or erythro-9-(2-hydroxy-3-nonyl)adenine (EHNA, ADA inhibitor) was added. The data are means ± S.D. from three independent experiments performed with cells of different donors. D, suppression of proliferation of CFSE-labeled CD4+CD25neg cells, which were incubated with CD4+CD39+ Treg at various S/RC ratios in the presence or absence of ZM241385 (a selective A2a and A2b receptor antagonist) was assessed (p < 0.001).

Similar articles

Cited by

References

    1. Strauss L., Bergmann C., Gooding W., Johnson J. T., Whiteside T. L. (2007) Clin. Cancer Res. 13, 6301–6311 - PubMed
    1. Cao X., Cai S. F., Fehniger T. A., Sonj J., Collins L. I., Piwnica-Worms D. R., Ley T. J. (2007) Immunity 27, 635–646 - PubMed
    1. Jonuleit H., Schmitt E., Stassen M., Tuettenberg A., Knop J., Enk A. H. (2001) J. Exp. Med. 193, 1285–1294 - PMC - PubMed
    1. Levings M. K., Sangregorio R., Roncarolo M. G. (2001) J. Exp. Med. 193, 1295–1302 - PMC - PubMed
    1. Dieckmann D., Plottner H., Berchtold S., Berger T., Schuler G. (2001) J. Exp. Med. 193, 1303–1310 - PMC - PubMed

Publication types

MeSH terms