Meta-analysis of genome-wide association studies: no efficiency gain in using individual participant data
- PMID: 19847795
- PMCID: PMC3878085
- DOI: 10.1002/gepi.20435
Meta-analysis of genome-wide association studies: no efficiency gain in using individual participant data
Abstract
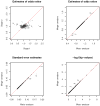
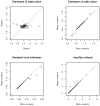
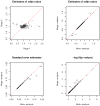
To identify genetic variants with modest effects on complex human diseases, a growing number of networks or consortia are created for sharing data from multiple genome-wide association studies on the same disease or related disorders. A central question in this enterprise is whether to obtain summary results or individual participant data from relevant studies. We show theoretically and numerically that meta-analysis of summary results is statistically as efficient as joint analysis of individual participant data (provided that both analyses are performed properly under the same modeling assumptions). We illustrate this equivalence with case-control data from the Finland-United States Investigation of NIDDM Genetics (FUSION) study. Collating only summary results will increase the number and representativeness of available studies, simplify data collection and analysis, reduce resource utilization, and accelerate discovery.
Figures


Similar articles
-
Were genome-wide linkage studies a waste of time? Exploiting candidate regions within genome-wide association studies.Genet Epidemiol. 2010 Feb;34(2):107-18. doi: 10.1002/gepi.20438. Genet Epidemiol. 2010. PMID: 19626703 Free PMC article.
-
Interrogating type 2 diabetes genome-wide association data using a biological pathway-based approach.Diabetes. 2009 Jun;58(6):1463-7. doi: 10.2337/db08-1378. Epub 2009 Feb 27. Diabetes. 2009. PMID: 19252133 Free PMC article.
-
METAINTER: meta-analysis of multiple regression models in genome-wide association studies.Bioinformatics. 2015 Jan 15;31(2):151-7. doi: 10.1093/bioinformatics/btu629. Epub 2014 Sep 23. Bioinformatics. 2015. PMID: 25252781
-
Practical issues in building risk-predicting models for complex diseases.J Biopharm Stat. 2010 Mar;20(2):415-40. doi: 10.1080/10543400903572829. J Biopharm Stat. 2010. PMID: 20309766 Free PMC article. Review.
-
Genome-wide association studies (GWAS): impact on elucidating the aetiology of diabetes.Diabetes Metab Res Rev. 2011 Oct;27(7):685-96. doi: 10.1002/dmrr.1221. Diabetes Metab Res Rev. 2011. PMID: 21630414 Review.
Cited by
-
Incorporating European GWAS findings improve polygenic risk prediction accuracy of breast cancer among East Asians.Genet Epidemiol. 2021 Jul;45(5):471-484. doi: 10.1002/gepi.22382. Epub 2021 Mar 19. Genet Epidemiol. 2021. PMID: 33739539 Free PMC article.
-
Meta-analysis methods for genome-wide association studies and beyond.Nat Rev Genet. 2013 Jun;14(6):379-89. doi: 10.1038/nrg3472. Epub 2013 May 9. Nat Rev Genet. 2013. PMID: 23657481 Review.
-
Analysis of rare, exonic variation amongst subjects with autism spectrum disorders and population controls.PLoS Genet. 2013 Apr;9(4):e1003443. doi: 10.1371/journal.pgen.1003443. Epub 2013 Apr 11. PLoS Genet. 2013. PMID: 23593035 Free PMC article.
-
Integrate multiple traits to detect novel trait-gene association using GWAS summary data with an adaptive test approach.Bioinformatics. 2019 Jul 1;35(13):2251-2257. doi: 10.1093/bioinformatics/bty961. Bioinformatics. 2019. PMID: 30476000 Free PMC article.
-
From genome-wide associations to candidate causal variants by statistical fine-mapping.Nat Rev Genet. 2018 Aug;19(8):491-504. doi: 10.1038/s41576-018-0016-z. Nat Rev Genet. 2018. PMID: 29844615 Free PMC article. Review.
References
-
- Cox DR, Hinkley DV. Theoretical Statistics. Chapman and Hall; 1979.
-
- Kavvoura1 FK, Ioannidis JPA. Methods for meta-analysis in genetic association studies: a review of their potential and pitfalls. Human Genetics. 2008;123:1–14. - PubMed
-
- Olkin I, Sampson A. Comparison of meta-analysis versus analysis of variance of individual patient data. Biometrics. 1998;54:317–22. - PubMed
-
- Price AL, Patterson NJ, Plenge RM, Weinblatt ME, Shadick NA, Reich D. Principal components analysis corrects for stratification in genome-wide association studies. Nature Genetics. 2006;38:904–909. - PubMed
Publication types
MeSH terms
Grants and funding
LinkOut - more resources
Full Text Sources

