. 2009 Nov 3;120(18):1800-13.
doi: 10.1161/CIRCULATIONAHA.109.859595. Epub 2009 Oct 19.

CC chemokine receptor-1 activates intimal smooth muscle-like cells in graft arterial disease

Affiliations

CC chemokine receptor-1 activates intimal smooth muscle-like cells in graft arterial disease

Koichi Shimizu et al. Circulation. .

Abstract

Background: Graft arterial disease (GAD) limits long-term solid-organ allograft survival. The thickened intima in GAD contains smooth muscle-like cells (SMLCs), leukocytes, and extracellular matrix. The intimal SMLCs in mouse GAD lesions differ from medial smooth muscle cells in their function and phenotype. Although intimal SMLCs may originate by migration and modulation of donor medial cells or by recruitment of host-derived precursors, the mechanisms that underlie their localization within grafts and the factors that drive these processes remain unclear.

Methods and results: This study of aortic transplantation in mice demonstrated an important function for chemokines beyond their traditional role in leukocyte recruitment and activation. Intimal SMLCs, but not medial smooth muscle cells, express functional CC chemokine receptor-1 (CCR1) and respond to RANTES by increased migration and proliferation. Although RANTES infusion in vivo promoted inflammatory cell accumulation in the adventitia of aortic allografts of wild-type and CCR1-deficient recipients, it increased GAD intimal thickening with SMLC proliferation in only the wild-type hosts. Aortic allografts transplanted into CCR1-deficient mice after wild-type bone marrow transplantation did not develop intimal lesions, which indicates that CCR1-bearing inflammatory cells do not contribute to intimal lesion formation. Moreover, RANTES induced SMLC proliferation in vitro but did not promote medial smooth muscle cell growth. Blockade of CCR5 attenuated RANTES-induced T-cell and monocyte/macrophage proliferation but did not affect RANTES-induced SMLC proliferation, consistent with a larger role of CCR1-binding chemokines in SMLC migration and proliferation and GAD development.

Conclusions: These studies provide a novel mechanistic insight into the formation of vascular intimal hyperplasia and suggest a novel therapeutic strategy for preventing allograft arteriopathy.


Figures
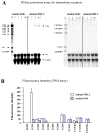
Figure 1
Figure 1
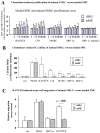
Chemokine receptor mRNA expression in medial SMCs vs intimal SMLCs. A, After culture for 24 hours in the presence of no cytokines (C), 500 U/mL interferon-γ (γ), 10 ng/mL tumor necrosis factor-α (α), or both cytokines (γ+α), cells were harvested and analyzed by RNase protection assay (RPA). Medial SMCs and nonstimulated SMLCs in culture did not express mRNA for any chemokine receptor (CC and CXCR RPA). Only intimal SMLCs showed chemokine receptor expression, and only after culture in TNF-α or TNF-α plus interferon-γ. m Indicates initial RPA probes. B, Fluorescence intensity values for chemokine receptor genes preferentially expressed in intimal SMLCs (open bars) and medial SMCs (solid bars) after culture for 24 hours in the presence of interferon-γ and TNF-α as measured by oligonucleotide microarrays. Error bars indicate variation in 2 hybridizations from duplicate preparations of the same sample. C, Western blot and densitometric analysis demonstrates higher expression of CCR1 by intimal SMLCs (iSMLC) than by medial SMCs (mSMC; a and b). B6 WT splenocytes served as positive control (pc), and B6 CCR1−/− splenocytes served as negative control (nc). D, Flow cytometry of intimal SMCs (iSMLC), medial SMCs (mSMC), and B6 CCR1−/− SMCs bearing SM myosin heavy chain. SM1, SMC marker, a through c; higher expression of CCR1 by intimal SMLCs than medial SMCs (d and e). B6 CCR1−/− SMCs served as negative control (c and f).
Figure 1
Figure 1
Chemokine receptor mRNA expression in medial SMCs vs intimal SMLCs. A, After culture for 24 hours in the presence of no cytokines (C), 500 U/mL interferon-γ (γ), 10 ng/mL tumor necrosis factor-α (α), or both cytokines (γ+α), cells were harvested and analyzed by RNase protection assay (RPA). Medial SMCs and nonstimulated SMLCs in culture did not express mRNA for any chemokine receptor (CC and CXCR RPA). Only intimal SMLCs showed chemokine receptor expression, and only after culture in TNF-α or TNF-α plus interferon-γ. m Indicates initial RPA probes. B, Fluorescence intensity values for chemokine receptor genes preferentially expressed in intimal SMLCs (open bars) and medial SMCs (solid bars) after culture for 24 hours in the presence of interferon-γ and TNF-α as measured by oligonucleotide microarrays. Error bars indicate variation in 2 hybridizations from duplicate preparations of the same sample. C, Western blot and densitometric analysis demonstrates higher expression of CCR1 by intimal SMLCs (iSMLC) than by medial SMCs (mSMC; a and b). B6 WT splenocytes served as positive control (pc), and B6 CCR1−/− splenocytes served as negative control (nc). D, Flow cytometry of intimal SMCs (iSMLC), medial SMCs (mSMC), and B6 CCR1−/− SMCs bearing SM myosin heavy chain. SM1, SMC marker, a through c; higher expression of CCR1 by intimal SMLCs than medial SMCs (d and e). B6 CCR1−/− SMCs served as negative control (c and f).
Figure 2
Figure 2
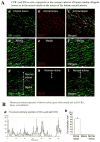
A, Confocal microscopic examination of coronary artery of human cardiac allograft (a through f) and human normal carotid arteries (g and h) stained with SM α-actin (a, d, and g) or CCR1 (b, e, and h) and merged image of SM α-actin and CCR1 (c, f, and i). B, Fluorescent intensity spectrum of SM α-actin (green) and CCR1 (red) of coronary artery of human cardiac allograft demonstrated colocalization of SM α-actin and CCR1 in intimal SMLCs (a); colocalization rate in intimal lesions and medial portions of coronary arteries of human cardiac allograft or normal intima of human carotid arteries (b). C, Confocal microscopic examination of murine aortic allografts (a through c) and murine normal aortas (d through f) stained with SM α-actin (a and d) or CCR1 (b and e) and merged image of SM α-actin and CCR1 (c and f). D, Fluorescent intensity spectrum of SM α-actin (green) and CCR1 (red) of murine aortic allografts demonstrated colocalization of SM α-actin and CCR1 in intimal SMLCs (a); colocalization rate in intimal lesions of murine aortic allografts and medial portions of murine normal aortas (b).
Figure 2
Figure 2
A, Confocal microscopic examination of coronary artery of human cardiac allograft (a through f) and human normal carotid arteries (g and h) stained with SM α-actin (a, d, and g) or CCR1 (b, e, and h) and merged image of SM α-actin and CCR1 (c, f, and i). B, Fluorescent intensity spectrum of SM α-actin (green) and CCR1 (red) of coronary artery of human cardiac allograft demonstrated colocalization of SM α-actin and CCR1 in intimal SMLCs (a); colocalization rate in intimal lesions and medial portions of coronary arteries of human cardiac allograft or normal intima of human carotid arteries (b). C, Confocal microscopic examination of murine aortic allografts (a through c) and murine normal aortas (d through f) stained with SM α-actin (a and d) or CCR1 (b and e) and merged image of SM α-actin and CCR1 (c and f). D, Fluorescent intensity spectrum of SM α-actin (green) and CCR1 (red) of murine aortic allografts demonstrated colocalization of SM α-actin and CCR1 in intimal SMLCs (a); colocalization rate in intimal lesions of murine aortic allografts and medial portions of murine normal aortas (b).
Figure 3
Figure 3
A, 3H-thymidine incorporation of intimal SMLCs (iSMLC, open bars) and medial SMCs (mSMC, solid bars) stimulated with various chemokines. RANTES, C10, and MARC (CCR1 ligands) induced SMLC but not SMC proliferation in a dose-dependent manner. B, Intracellular Ca2+ influx measurement. Basal fluorescence intensity was subtracted from maximum fluorescence intensity to estimate intracellular Ca2+. Changes in fluorescence intensity were largest in RANTES-treated intimal SMLCs among various CC chemokines. Fluorescence intensities in RANTES-treated, C10-treated, and MARC-treated intimal SMLCs were significantly larger than in medial SMCs (543.2±262.6 in intimal SMLCs, 37.6±19.2 in medial SMCs, P<0.005; 272.2±73.3 in intimal SMLCs, 34.2±33.1 in medial SMCs, P<0.005; and 176.0±46.9 in intimal SMLCs, 31.2±15.3 in medial SMCs, P<0.0005, respectively). MIP-1α – treated and MIP-1γ – treated intimal SMLCs also showed significantly higher calcium influx responses than did medial SMCs (149.4±15.8 in intimal SMLCs, 42.2±20.4 in medial SMCs, P<0.0001; 116.4±34.6 in intimal SMLCs, 16.0±13.2 in medial SMCs, P<0.0003). PDGF-treated intimal SMLCs and medial SMCs showed comparably strong responses (630.4±68.9 in intimal SMLCs, 620.0±156.0 in medial SMCs, P=0.89). C, Migration assay of intimal SMLCs (open bars) and medial SMCs (solid bars) by modified Boyden chamber methods. RANTES induced higher rates of migration of intimal SMLCs than medial SMCs, but negative control, positive control (PDGF), and MIP-1α showed comparable migration rates between intimal SMLCs and medial SMCs. Ctrl indicates control. D, 3H-thymidine incorporation of intimal SMLCs treated with 1 μL/mL anti-CCR3 or anti-CCR5 blocking antibodies or isotype-matched control (ctrl) antibodies followed by stimulation with 100 ng/mL RANTES.
Figure 3
Figure 3
A, 3H-thymidine incorporation of intimal SMLCs (iSMLC, open bars) and medial SMCs (mSMC, solid bars) stimulated with various chemokines. RANTES, C10, and MARC (CCR1 ligands) induced SMLC but not SMC proliferation in a dose-dependent manner. B, Intracellular Ca2+ influx measurement. Basal fluorescence intensity was subtracted from maximum fluorescence intensity to estimate intracellular Ca2+. Changes in fluorescence intensity were largest in RANTES-treated intimal SMLCs among various CC chemokines. Fluorescence intensities in RANTES-treated, C10-treated, and MARC-treated intimal SMLCs were significantly larger than in medial SMCs (543.2±262.6 in intimal SMLCs, 37.6±19.2 in medial SMCs, P<0.005; 272.2±73.3 in intimal SMLCs, 34.2±33.1 in medial SMCs, P<0.005; and 176.0±46.9 in intimal SMLCs, 31.2±15.3 in medial SMCs, P<0.0005, respectively). MIP-1α – treated and MIP-1γ – treated intimal SMLCs also showed significantly higher calcium influx responses than did medial SMCs (149.4±15.8 in intimal SMLCs, 42.2±20.4 in medial SMCs, P<0.0001; 116.4±34.6 in intimal SMLCs, 16.0±13.2 in medial SMCs, P<0.0003). PDGF-treated intimal SMLCs and medial SMCs showed comparably strong responses (630.4±68.9 in intimal SMLCs, 620.0±156.0 in medial SMCs, P=0.89). C, Migration assay of intimal SMLCs (open bars) and medial SMCs (solid bars) by modified Boyden chamber methods. RANTES induced higher rates of migration of intimal SMLCs than medial SMCs, but negative control, positive control (PDGF), and MIP-1α showed comparable migration rates between intimal SMLCs and medial SMCs. Ctrl indicates control. D, 3H-thymidine incorporation of intimal SMLCs treated with 1 μL/mL anti-CCR3 or anti-CCR5 blocking antibodies or isotype-matched control (ctrl) antibodies followed by stimulation with 100 ng/mL RANTES.
Figure 4
Figure 4
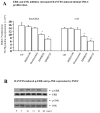
A, Proliferation of SMLCs (3H-thymidine incorporation) stimulated with 100 ng/mL RANTES or C10 in the presence or absence of various kinase inhibitors: SB202190 (p38 inhibitor, 5 μmol/L), SP600125 (JNK inhibitor, 10 μmol/L), wortmannin (phosphatidylinositol 3-kinase inhibitor, 1 μmol/L), and PD98059 (MEK1 inhibitor, 50 μmol/L). 3H-thymidine incorporation of RANTES-stimulated SMLCs decreased significantly with PD98059 (10.1±0.3×10⁴ cpm, n=4, P<0.001) and with SP600125 (7.2±0.5×10⁴ cpm, P<0.0001) compared with control cells (ctrl; 15.6±1.7×10⁴ cpm, n=4). 3H-thymidine incorporation of C10-stimulated SMLCs also significantly decreased with PD98059 (8.7±0.7×10⁴ cpm, n=4, P<0.0001) and with SP600125 (6.0±0.5×10⁴ cpm, n=4, P<0.0001) compared with control cells (13.9±0.6×10⁴ cpm, n=4). B, Western blot demonstrated that RANTES induced phosphorylation of extracellular signal-regulated kinase (ERK) and JNK in SMLCs. C, Western blot demonstrated that JNK small interfering RNA (siRNA) reduced JNK expression. c Indicates control; i, siRNA treatment. D, 3H-thymidine incorporation of RANTES-stimulated SMLCs decreased significantly with JNK siRNA (3.0±0.3×10⁴, P=0.0006) compared with RANTES-stimulated SMLCs treated with RNA interference–negative controls (4.9±0.5×10⁴ cpm, n=4). Ctrl indicates control.
Figure 4
Figure 4
A, Proliferation of SMLCs (3H-thymidine incorporation) stimulated with 100 ng/mL RANTES or C10 in the presence or absence of various kinase inhibitors: SB202190 (p38 inhibitor, 5 μmol/L), SP600125 (JNK inhibitor, 10 μmol/L), wortmannin (phosphatidylinositol 3-kinase inhibitor, 1 μmol/L), and PD98059 (MEK1 inhibitor, 50 μmol/L). 3H-thymidine incorporation of RANTES-stimulated SMLCs decreased significantly with PD98059 (10.1±0.3×10⁴ cpm, n=4, P<0.001) and with SP600125 (7.2±0.5×10⁴ cpm, P<0.0001) compared with control cells (ctrl; 15.6±1.7×10⁴ cpm, n=4). 3H-thymidine incorporation of C10-stimulated SMLCs also significantly decreased with PD98059 (8.7±0.7×10⁴ cpm, n=4, P<0.0001) and with SP600125 (6.0±0.5×10⁴ cpm, n=4, P<0.0001) compared with control cells (13.9±0.6×10⁴ cpm, n=4). B, Western blot demonstrated that RANTES induced phosphorylation of extracellular signal-regulated kinase (ERK) and JNK in SMLCs. C, Western blot demonstrated that JNK small interfering RNA (siRNA) reduced JNK expression. c Indicates control; i, siRNA treatment. D, 3H-thymidine incorporation of RANTES-stimulated SMLCs decreased significantly with JNK siRNA (3.0±0.3×10⁴, P=0.0006) compared with RANTES-stimulated SMLCs treated with RNA interference–negative controls (4.9±0.5×10⁴ cpm, n=4). Ctrl indicates control.
Figure 5
Figure 5
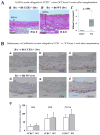
A, Hematoxylin-and-eosin (H&E) staining of intimal lesions of aortic allografts in CCR1- deficient recipients (a) vs WT recipients (b). Bar=10 μm. c, Allografts in CCR1-deficient hosts showed significantly reduced intimal area of GAD lesions (median [interquartile range] 0.002 [0.001 to 0.007] mm2, n=10, P<0.001) compared with allografts in WT recipients (0.26 [0.12 to 0.32] mm2, n=12). B, Immunohistochemistry of total allogeneic aortic allografts. BALB/c aorta transplanted into B6CCR1−/− (a, b, and c) or WT B6 (d, e, and f) 1 week after transplantation; staining with CD4 (a and d), CD8 (d and e), and CD11b (c and f). Bar=20 μm. g, Graft accumulation number of inflammatory cells per section of the aortic allografts of CCR1−/− (n=6) and WT (n=6) recipients was counted under the microscope. 8w Indicates 8 weeks; 1w, 1 week.
Figure 6
Figure 6
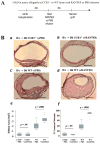
A, Experimental scheme of RANTES infusion in vivo experiment. A miniaturized osmotic pump in the dorsal lower pocket delivered recombinant RANTES (10 μg per week) for 4 weeks (4w) to B6 CCR1−/− or B6 WT recipients of B/c aortic allografts 4 weeks after aortic transplantation (each n=6). PBS served as negative control (a and c; each n=6). B, Hematoxylin-and-eosin staining of aortic allografts of CCR1−/− (a, with PBS; b, with RANTES) or B6 WT recipients (c, with PBS; d, with RANTES) 8 weeks after transplantation. Bar=200 μm. RANTES infusion did not affect intimal area (e) or luminal stenosis (f) of CCR1-deficient host allografts, but RANTES infusion significantly augmented intimal area of GAD lesions compared with PBS infusion. C, Confocal microscopic pictures of BrdU (red) incorporation in intimal SM α-actin (SMA; green)–positive cells responding to RANTES infusion; upper panels, aortic allograft intimal lesions of B6 WT recipients receiving PBS, and lower panels, B6 WT recipients receiving RANTES. Confocal microscopic analysis showed that RANTES infusion significantly increased BrdU (red) incorporation in intimal SM α-actin (green)–positive cells in aortic allografts compared with control PBS treatment group (g).
Figure 6
Figure 6
A, Experimental scheme of RANTES infusion in vivo experiment. A miniaturized osmotic pump in the dorsal lower pocket delivered recombinant RANTES (10 μg per week) for 4 weeks (4w) to B6 CCR1−/− or B6 WT recipients of B/c aortic allografts 4 weeks after aortic transplantation (each n=6). PBS served as negative control (a and c; each n=6). B, Hematoxylin-and-eosin staining of aortic allografts of CCR1−/− (a, with PBS; b, with RANTES) or B6 WT recipients (c, with PBS; d, with RANTES) 8 weeks after transplantation. Bar=200 μm. RANTES infusion did not affect intimal area (e) or luminal stenosis (f) of CCR1-deficient host allografts, but RANTES infusion significantly augmented intimal area of GAD lesions compared with PBS infusion. C, Confocal microscopic pictures of BrdU (red) incorporation in intimal SM α-actin (SMA; green)–positive cells responding to RANTES infusion; upper panels, aortic allograft intimal lesions of B6 WT recipients receiving PBS, and lower panels, B6 WT recipients receiving RANTES. Confocal microscopic analysis showed that RANTES infusion significantly increased BrdU (red) incorporation in intimal SM α-actin (green)–positive cells in aortic allografts compared with control PBS treatment group (g).
Figure 7
Figure 7
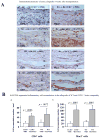
A, Immunohistochemistry of 8-week aortic allografts; BALB/c aorta transplanted into B6CCR1−/− with PBS (a and b) or RANTES (c and d) treatment or WT B6 with PBS (e and f) or RANTES (g and h) treatment; staining with CD4 (a, c, e, and g) and Mac3 (b, d, f, and h). Bar=20 μm. B, Graft accumulation number of inflammatory cells per section of the aortic allografts of CCR1−/− and WT recipients treated with PBS or RANTES (each n=6) was counted under the microscope.
Figure 8
Figure 8
A, Experimental protocol for combined BMT and aortic transplantation. 2w Indicates 2 weeks; 4w, 4 weeks. B, Immunohistochemistry from 8-week aortic allografts after BMT; B6 WT(a) and/or B6 CCR1−/− hosts (b) received B6 WT BMT. BALB/c aortas were transplanted 2 weeks after BMT and evaluated 8 weeks later. Bar=20 μm.

Comment in

Similar articles

Cited by

References

    1. Libby P, Salomon RN, Payne DD, Schoen FJ, Pober JS. Functions of vascular wall cells related to development of transplantation-associated coronary arteriosclerosis. Transplant Proc. 1989;21:3677–3684. - PubMed
    1. Libby P, Pober JS. Chronic rejection. Immunity. 2001;14:387–397. - PubMed
    1. Kennedy LJ, Jr, Weissman IL. Dual origin of intimal cells in cardiac-allograft arteriosclerosis. N Engl J Med. 1971;285:884–887. - PubMed
    1. Shimizu K, Sugiyama S, Aikawa M, Fukumoto Y, Rabkin E, Libby P, Mitchell RN. Host bone-marrow cells are a source of donor intimal smooth- muscle-like cells in murine aortic transplant arteriopathy. Nat Med. 2001;7:738–741. - PubMed
    1. Shimizu K, Mitchell RN. Stem cell origins of intimal cells in graft arterial disease. Curr Atheroscler Rep. 2003;5:230–237. - PubMed

Publication types