Unraveling the structure of DNA during overstretching by using multicolor, single-molecule fluorescence imaging
- PMID: 19841258
- PMCID: PMC2775282
- DOI: 10.1073/pnas.0904322106
Unraveling the structure of DNA during overstretching by using multicolor, single-molecule fluorescence imaging
Abstract
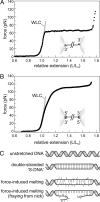
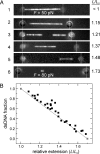
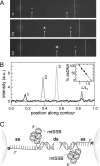
Single-molecule manipulation studies have revealed that double-stranded DNA undergoes a structural transition when subjected to tension. At forces that depend on the attachment geometry of the DNA (65 pN or 110 pN), it elongates approximately 1.7-fold and its elastic properties change dramatically. The nature of this overstretched DNA has been under debate. In one model, the DNA cooperatively unwinds, while base pairing remains intact. In a competing model, the hydrogen bonds between base pairs break and two single DNA strands are formed, comparable to thermal DNA melting. Here, we resolve the structural basis of DNA overstretching using a combination of fluorescence microscopy, optical tweezers, and microfluidics. In DNA molecules undergoing the transition, we visualize double- and single-stranded segments using specific fluorescent labels. Our data directly demonstrate that overstretching comprises a gradual conversion from double-stranded to single-stranded DNA, irrespective of the attachment geometry. We found that these conversions favorably initiate from nicks or free DNA ends. These discontinuities in the phosphodiester backbone serve as energetically favorable nucleation points for melting. When both DNA strands are intact and no nicks or free ends are present, the overstretching force increases from 65 to 110 pN and melting initiates throughout the molecule, comparable to thermal melting. These results provide unique insights in the thermodynamics of DNA and DNA-protein interactions.
Conflict of interest statement
The authors declare no conflict of interest.
Figures


Comment in
-
Peeling back the mystery of DNA overstretching.Proc Natl Acad Sci U S A. 2009 Oct 27;106(43):18047-8. doi: 10.1073/pnas.0910269106. Epub 2009 Oct 21. Proc Natl Acad Sci U S A. 2009. PMID: 19846782 Free PMC article. No abstract available.
Similar articles
-
Revealing the competition between peeled ssDNA, melting bubbles, and S-DNA during DNA overstretching using fluorescence microscopy.Proc Natl Acad Sci U S A. 2013 Mar 5;110(10):3859-64. doi: 10.1073/pnas.1213676110. Epub 2013 Feb 19. Proc Natl Acad Sci U S A. 2013. PMID: 23431161 Free PMC article.
-
Revealing the competition between peeled ssDNA, melting bubbles, and S-DNA during DNA overstretching by single-molecule calorimetry.Proc Natl Acad Sci U S A. 2013 Mar 5;110(10):3865-70. doi: 10.1073/pnas.1213740110. Epub 2013 Feb 19. Proc Natl Acad Sci U S A. 2013. PMID: 23431154 Free PMC article.
-
Force spectroscopy and fluorescence microscopy of dsDNA-YOYO-1 complexes: implications for the structure of dsDNA in the overstretching region.Nucleic Acids Res. 2010 Jun;38(10):3423-31. doi: 10.1093/nar/gkq034. Epub 2010 Feb 2. Nucleic Acids Res. 2010. PMID: 20129944 Free PMC article.
-
Thermodynamics of DNA interactions from single molecule stretching experiments.Acc Chem Res. 2002 Mar;35(3):159-66. doi: 10.1021/ar010045k. Acc Chem Res. 2002. PMID: 11900519 Review.
-
Denaturation transition of stretched DNA.Biochem Soc Trans. 2013 Apr;41(2):639-45. doi: 10.1042/BST20120298. Biochem Soc Trans. 2013. PMID: 23514169 Review.
Cited by
-
Exploring protein-DNA interactions in 3D using in situ construction, manipulation and visualization of individual DNA dumbbells with optical traps, microfluidics and fluorescence microscopy.Nat Protoc. 2013 Mar;8(3):525-38. doi: 10.1038/nprot.2013.016. Epub 2013 Feb 14. Nat Protoc. 2013. PMID: 23411634 Free PMC article.
-
Single-molecule stretching studies of RNA chaperones.RNA Biol. 2010 Nov-Dec;7(6):712-23. doi: 10.4161/rna.7.6.13776. Epub 2010 Nov 1. RNA Biol. 2010. PMID: 21045548 Free PMC article. Review.
-
Two distinct conformational states define the interaction of human RAD51-ATP with single-stranded DNA.EMBO J. 2018 Apr 3;37(7):e98162. doi: 10.15252/embj.201798162. Epub 2018 Mar 5. EMBO J. 2018. PMID: 29507080 Free PMC article.
-
The transition mechanism of DNA overstretching: a microscopic view using molecular dynamics.J R Soc Interface. 2014 Aug 6;11(97):20140399. doi: 10.1098/rsif.2014.0399. J R Soc Interface. 2014. PMID: 24920111 Free PMC article.
-
Strongly Bent Double-Stranded DNA: Reconciling Theory and Experiment.Front Phys. 2019 Nov;7:195. doi: 10.3389/fphy.2019.00195. Epub 2019 Nov 29. Front Phys. 2019. PMID: 32601596 Free PMC article.
References
-
- Smith SB, Finzi L, Bustamante C. Direct mechanical measurements of the elasticity of single DNA molecules by using magnetic beads. Science. 1992;258:1122–1126. - PubMed
-
- Smith SB, Cui Y, Bustamante C. Overstretching B-DNA: The elastic response of individual double-stranded and single-stranded DNA molecules. Science. 1996;271:795–799. - PubMed
-
- Cluzel P, et al. DNA: An extensible molecule. Science. 1996;271:792–794. - PubMed
-
- Léger JF, et al. Structural transitions of a twisted and stretched DNA molecule. Phys Rev Lett. 1999;83:1066.
-
- Bryant Z, et al. Structural transitions and elasticity from torque measurements on DNA. Nature. 2003;424:338–341. - PubMed
Publication types
MeSH terms
Substances
LinkOut - more resources
Full Text Sources
Other Literature Sources

