CCCTC-binding factor and the transcription factor T-bet orchestrate T helper 1 cell-specific structure and function at the interferon-gamma locus
- PMID: 19818655
- PMCID: PMC2810421
- DOI: 10.1016/j.immuni.2009.08.021
CCCTC-binding factor and the transcription factor T-bet orchestrate T helper 1 cell-specific structure and function at the interferon-gamma locus
Abstract
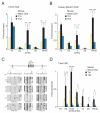
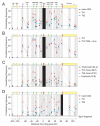
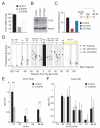
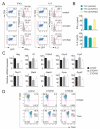
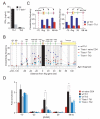
How cell type-specific differences in chromatin conformation are achieved and their contribution to gene expression are incompletely understood. Here we identify a cryptic upstream orchestrator of interferon-gamma (IFNG) transcription, which is embedded within the human IL26 gene, compromised of a single CCCTC-binding factor (CTCF) binding site and retained in all mammals, even surviving near-complete evolutionary deletion of the equivalent gene encoding IL-26 in rodents. CTCF and cohesins occupy this element in vivo in a cell type-nonspecific manner. This element is juxtaposed to two other sites located within the first intron and downstream of Ifng, where CTCF, cohesins, and the transcription factor T-bet bind in a T helper 1 (Th1) cell-specific manner. These interactions, close proximity of other elements within the locus to each other and to the gene encoding interferon-gamma, and robust murine Ifng expression are dependent on CTCF and T-bet. The results demonstrate that cooperation between architectural (CTCF) and transcriptional enhancing (T-bet) factors and the elements to which they bind is required for proper Th1 cell-specific expression of Ifng.
Figures


Similar articles
-
Modular utilization of distal cis-regulatory elements controls Ifng gene expression in T cells activated by distinct stimuli.Immunity. 2010 Jul 23;33(1):35-47. doi: 10.1016/j.immuni.2010.07.004. Immunity. 2010. PMID: 20643337 Free PMC article.
-
IL-28A is a key regulator of T-cell-mediated liver injury via the T-box transcription factor T-bet.Gastroenterology. 2007 Jan;132(1):358-71. doi: 10.1053/j.gastro.2006.10.028. Epub 2006 Oct 21. Gastroenterology. 2007. PMID: 17241885
-
A CTCF-binding site in the Mdm1-Il22-Ifng locus shapes cytokine expression profiles and plays a critical role in early Th1 cell fate specification.Immunity. 2024 May 14;57(5):1005-1018.e7. doi: 10.1016/j.immuni.2024.04.007. Epub 2024 May 1. Immunity. 2024. PMID: 38697116
-
Cohesin, CTCF and lymphocyte antigen receptor locus rearrangement.Trends Immunol. 2012 Apr;33(4):153-9. doi: 10.1016/j.it.2012.02.004. Epub 2012 Mar 20. Trends Immunol. 2012. PMID: 22440186 Free PMC article. Review.
-
The role of CTCF in coordinating the expression of single gene loci.Biochem Cell Biol. 2011 Oct;89(5):489-94. doi: 10.1139/o11-040. Epub 2011 Sep 14. Biochem Cell Biol. 2011. PMID: 21916612 Review.
Cited by
-
Epigenetic Activation and Silencing of the Gene that Encodes IFN-γ.Front Immunol. 2013 May 16;4:112. doi: 10.3389/fimmu.2013.00112. eCollection 2013. Front Immunol. 2013. PMID: 23720660 Free PMC article.
-
Spatial Organization of Chromatin: Transcriptional Control of Adaptive Immune Cell Development.Front Immunol. 2021 Mar 29;12:633825. doi: 10.3389/fimmu.2021.633825. eCollection 2021. Front Immunol. 2021. PMID: 33854505 Free PMC article. Review.
-
Role of YY1 in long-range chromosomal interactions regulating Th2 cytokine expression.Transcription. 2014;5(2):e27976. doi: 10.4161/trns.27976. Transcription. 2014. PMID: 25764217 Free PMC article.
-
Transcriptional regulation of T helper type 2 differentiation.Immunology. 2014 Apr;141(4):498-505. doi: 10.1111/imm.12216. Immunology. 2014. PMID: 24245687 Free PMC article. Review.
-
Restraint of IFN-γ expression through a distal silencer CNS-28 for tissue homeostasis.Immunity. 2023 May 9;56(5):944-958.e6. doi: 10.1016/j.immuni.2023.03.006. Epub 2023 Apr 10. Immunity. 2023. PMID: 37040761 Free PMC article.
References
-
- Agarwal S, Rao A. Modulation of chromatin structure regulates cytokine gene expression during T cell differentiation. Immunity. 1998;9:765–775. - PubMed
-
- Ansel KM, Djuretic I, Tanasa B, Rao A. Regulation of Th2 differentiation and Il4 locus accessibility. Annu Rev Immunol. 2006;24:607–656. - PubMed
-
- Apostolou E, Thanos D. Linking differential chromatin loops to transcriptional decisions. Mol Cell. 2008;29:154–156. - PubMed
-
- Cai S, Lee CC, Kohwi-Shigematsu T. SATB1 packages densely looped, transcriptionally active chromatin for coordinated expression of cytokine genes. Nat Genet. 2006;38:1278–1288. - PubMed
Publication types
MeSH terms
Substances
Grants and funding
- R01 GM071923/GM/NIGMS NIH HHS/United States
- R01 AI071272-08/AI/NIAID NIH HHS/United States
- U54 HG004592-03S1/HG/NHGRI NIH HHS/United States
- N01AI40069/AI/NIAID NIH HHS/United States
- GMT3207270/PHS HHS/United States
- U54 HG004592-02S1/HG/NHGRI NIH HHS/United States
- R01 GM071852/GM/NIGMS NIH HHS/United States
- R01 AI061061-05/AI/NIAID NIH HHS/United States
- R01 GM071923-04/GM/NIGMS NIH HHS/United States
- R01 HD018184-28/HD/NICHD NIH HHS/United States
- R01 GM071852-05/GM/NIGMS NIH HHS/United States
- R01-AI071282/AI/NIAID NIH HHS/United States
- R01-GM71923/GM/NIGMS NIH HHS/United States
- N01 AI040069/AI/NIAID NIH HHS/United States
- R01-AI061061/AI/NIAID NIH HHS/United States
- R01-GM71852/GM/NIGMS NIH HHS/United States
- U54 HG004592-02/HG/NHGRI NIH HHS/United States
- U54 HG004592-03/HG/NHGRI NIH HHS/United States
- U54-HG004592/HG/NHGRI NIH HHS/United States
- R01 GM071923-03/GM/NIGMS NIH HHS/United States
- R01 GM071852-04/GM/NIGMS NIH HHS/United States
- R01 HD018184-29/HD/NICHD NIH HHS/United States
- R01 AI061061/AI/NIAID NIH HHS/United States
- R01 HD018184/HD/NICHD NIH HHS/United States
- R01-HD18184/HD/NICHD NIH HHS/United States
- R01 AI071272-07/AI/NIAID NIH HHS/United States
- U54 HG004592/HG/NHGRI NIH HHS/United States
LinkOut - more resources
Full Text Sources
Molecular Biology Databases

