

Lysophosphatidylcholine activates adipocyte glucose uptake and lowers blood glucose levels in murine models of diabetes
- PMID: 19815546
- PMCID: PMC2797153
- DOI: 10.1074/jbc.M109.024869
Lysophosphatidylcholine activates adipocyte glucose uptake and lowers blood glucose levels in murine models of diabetes
Abstract
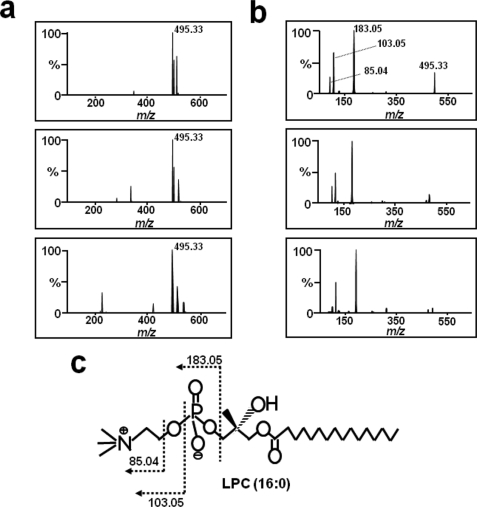
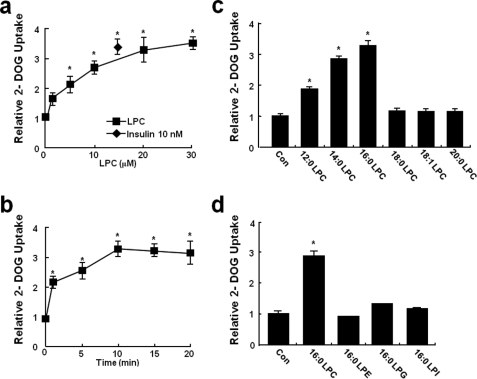
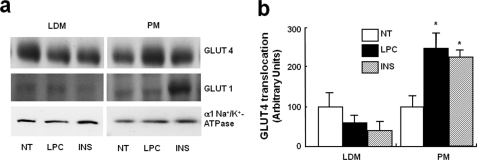
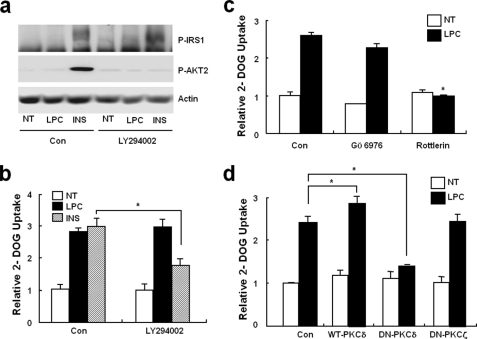
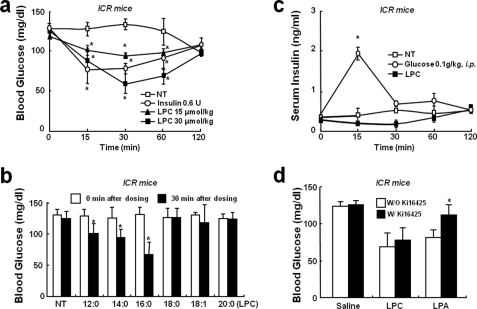
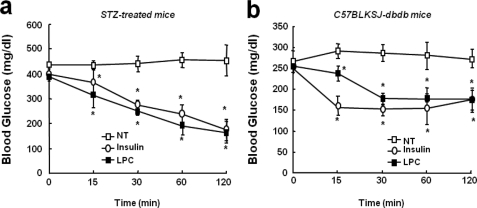
Glucose homeostasis is maintained by the orchestration of peripheral glucose utilization and hepatic glucose production, mainly by insulin. In this study, we found by utilizing a combined parallel chromatography mass profiling approach that lysophosphatidylcholine (LPC) regulates glucose levels. LPC was found to stimulate glucose uptake in 3T3-L1 adipocytes dose- and time-dependently, and this activity was found to be sensitive to variations in acyl chain lengths and to polar head group types in LPC. Treatment with LPC resulted in a significant increase in the level of GLUT4 at the plasma membranes of 3T3-L1 adipocytes. Moreover, LPC did not affect IRS-1 and AKT2 phosphorylations, and LPC-induced glucose uptake was not influenced by pretreatment with the PI 3-kinase inhibitor LY294002. However, glucose uptake stimulation by LPC was abrogated both by rottlerin (a protein kinase Cdelta inhibitor) and by the adenoviral expression of dominant negative protein kinase Cdelta. In line with its determined cellular functions, LPC was found to lower blood glucose levels in normal mice. Furthermore, LPC improved blood glucose levels in mouse models of type 1 and 2 diabetes. These results suggest that an understanding of the mode of action of LPC may provide a new perspective of glucose homeostasis.
Figures

Similar articles
-
Lysophosphatidic acid regulates blood glucose by stimulating myotube and adipocyte glucose uptake.J Mol Med (Berl). 2008 Feb;86(2):211-20. doi: 10.1007/s00109-007-0269-z. Epub 2007 Oct 9. J Mol Med (Berl). 2008. PMID: 17924084
-
Arsenite stimulated glucose transport in 3T3-L1 adipocytes involves both Glut4 translocation and p38 MAPK activity.Eur J Biochem. 2003 Oct;270(19):3891-903. doi: 10.1046/j.1432-1033.2003.03771.x. Eur J Biochem. 2003. PMID: 14511371
-
Activation of the mammalian target of rapamycin pathway acutely inhibits insulin signaling to Akt and glucose transport in 3T3-L1 and human adipocytes.Endocrinology. 2005 Mar;146(3):1328-37. doi: 10.1210/en.2004-0777. Epub 2004 Dec 2. Endocrinology. 2005. PMID: 15576463
-
ApoA-IV improves insulin sensitivity and glucose uptake in mouse adipocytes via PI3K-Akt Signaling.Sci Rep. 2017 Jan 24;7:41289. doi: 10.1038/srep41289. Sci Rep. 2017. PMID: 28117404 Free PMC article.
-
A new chromanone isolated from Portulaca oleracea L. increases glucose uptake by stimulating GLUT4 translocation to the plasma membrane in 3T3-L1 adipocytes.Int J Biol Macromol. 2019 Feb 15;123:26-34. doi: 10.1016/j.ijbiomac.2018.10.206. Epub 2018 Oct 30. Int J Biol Macromol. 2019. PMID: 30389528
Cited by
-
Exposure to persistent organic pollutants alters the serum metabolome in non-obese diabetic mice.Metabolomics. 2022 Nov 3;18(11):87. doi: 10.1007/s11306-022-01945-0. Metabolomics. 2022. PMID: 36329300 Free PMC article.
-
Action mechanism of hypoglycemic principle 9-(R)-HODE isolated from cortex lycii based on a metabolomics approach.Front Pharmacol. 2022 Oct 21;13:1011608. doi: 10.3389/fphar.2022.1011608. eCollection 2022. Front Pharmacol. 2022. PMID: 36339561 Free PMC article.
-
Obesity Genomics and Metabolomics: a Nexus of Cardiometabolic Risk.Curr Cardiol Rep. 2020 Oct 10;22(12):174. doi: 10.1007/s11886-020-01422-x. Curr Cardiol Rep. 2020. PMID: 33040225 Free PMC article. Review.
-
Hibernation and plasma lipids in free-ranging brown bears-implications for diabetes.PLoS One. 2023 Sep 5;18(9):e0291063. doi: 10.1371/journal.pone.0291063. eCollection 2023. PLoS One. 2023. PMID: 37669305 Free PMC article.
-
Plasma lysophosphatidylcholine levels are reduced in obesity and type 2 diabetes.PLoS One. 2012;7(7):e41456. doi: 10.1371/journal.pone.0041456. Epub 2012 Jul 25. PLoS One. 2012. PMID: 22848500 Free PMC article. Clinical Trial.
References
-
- Saltiel A. R., Kahn C. R. (2001) Nature 414, 799–806 - PubMed
-
- Chiasson J. L., Rabasa-Lhoret R. (2004) Diabetes 53, (Suppl. 3) S34–S38 - PubMed
-
- Moller D. E. (2001) Nature 414, 821–827 - PubMed
-
- Hespel P., Vergauwen L., Vandenberghe K., Richter E. A. (1996) Diabetes 45, (Suppl. 1) S99–S104 - PubMed
-
- Elmendorf J. S. (2002) J. Membr. Biol. 190, 167–174 - PubMed
Publication types
MeSH terms
Substances
LinkOut - more resources
Full Text Sources
Other Literature Sources
Medical
Research Materials
Miscellaneous
