

Genomic determination of the glucocorticoid response reveals unexpected mechanisms of gene regulation
- PMID: 19801529
- PMCID: PMC2792167
- DOI: 10.1101/gr.097022.109
Genomic determination of the glucocorticoid response reveals unexpected mechanisms of gene regulation
Abstract
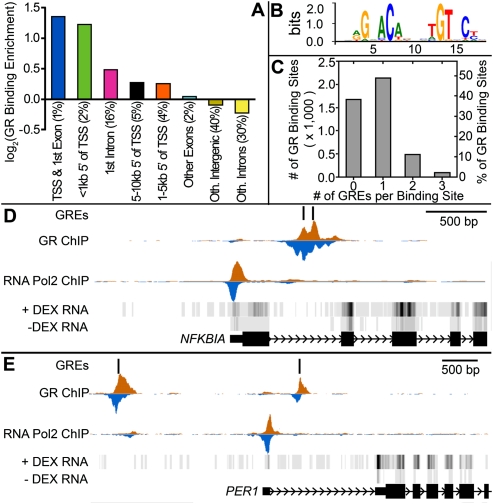
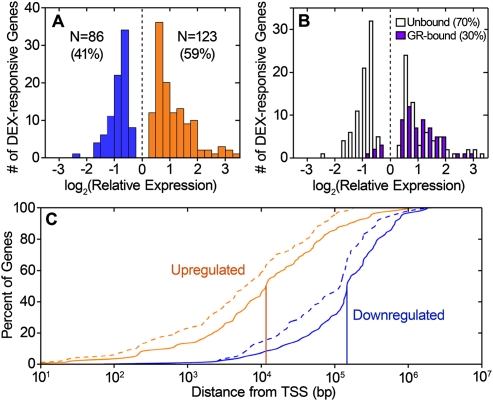
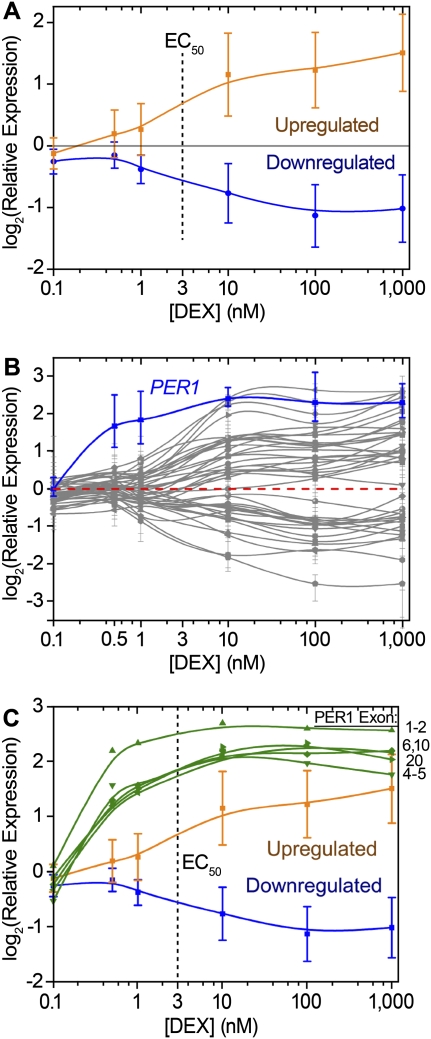
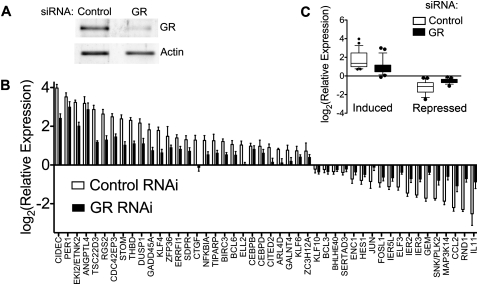
The glucocorticoid steroid hormone cortisol is released by the adrenal glands in response to stress and serves as a messenger in circadian rhythms. Transcriptional responses to this hormonal signal are mediated by the glucocorticoid receptor (GR). We determined GR binding throughout the human genome by using chromatin immunoprecipitation followed by next-generation DNA sequencing, and measured related changes in gene expression with mRNA sequencing in response to the glucocorticoid dexamethasone (DEX). We identified 4392 genomic positions occupied by the GR and 234 genes with significant changes in expression in response to DEX. This genomic census revealed striking differences between gene activation and repression by the GR. While genes activated with DEX treatment have GR bound within a median distance of 11 kb from the transcriptional start site (TSS), the nearest GR binding for genes repressed with DEX treatment is a median of 146 kb from the TSS, suggesting that DEX-mediated repression occurs independently of promoter-proximal GR binding. In addition to the dramatic differences in proximity of GR binding, we found differences in the kinetics of gene expression response for induced and repressed genes, with repression occurring substantially after induction. We also found that the GR can respond to different levels of corticosteroids in a gene-specific manner. For example, low doses of DEX selectively induced PER1, a transcription factor involved in regulating circadian rhythms. Overall, the genome-wide determination and analysis of GR:DNA binding and transcriptional response to hormone reveals new insights into the complexities of gene regulatory activities managed by GR.
Figures

Similar articles
-
Dexamethasone-mediated repression of MUC5AC gene expression in human lung epithelial cells.Am J Respir Cell Mol Biol. 2006 Mar;34(3):338-47. doi: 10.1165/rcmb.2005-0176OC. Epub 2005 Oct 20. Am J Respir Cell Mol Biol. 2006. PMID: 16239644 Free PMC article.
-
Glucocorticoid receptor ChIP-sequencing of subcutaneous fat reveals modulation of inflammatory pathways.Obesity (Silver Spring). 2015 Nov;23(11):2286-93. doi: 10.1002/oby.21251. Epub 2015 Sep 26. Obesity (Silver Spring). 2015. PMID: 26408078 Free PMC article.
-
Dexamethasone induces a putative repressor complex and chromatin modifications in the CRH promoter.Mol Endocrinol. 2013 Jul;27(7):1142-52. doi: 10.1210/me.2013-1079. Epub 2013 May 13. Mol Endocrinol. 2013. PMID: 23671328 Free PMC article.
-
How glucocorticoid receptors modulate the activity of other transcription factors: a scope beyond tethering.Mol Cell Endocrinol. 2013 Nov 5;380(1-2):41-54. doi: 10.1016/j.mce.2012.12.014. Epub 2012 Dec 23. Mol Cell Endocrinol. 2013. PMID: 23267834 Review.
-
Complex dynamics of transcription regulation.Biochim Biophys Acta. 2012 Jul;1819(7):657-66. doi: 10.1016/j.bbagrm.2012.03.004. Epub 2012 Mar 28. Biochim Biophys Acta. 2012. PMID: 22484099 Free PMC article. Review.
Cited by
-
Modeling gene × environment interactions in PTSD using human neurons reveals diagnosis-specific glucocorticoid-induced gene expression.Nat Neurosci. 2022 Nov;25(11):1434-1445. doi: 10.1038/s41593-022-01161-y. Epub 2022 Oct 20. Nat Neurosci. 2022. PMID: 36266471 Free PMC article.
-
Insights into glucocorticoid responses derived from omics studies.Pharmacol Ther. 2021 Feb;218:107674. doi: 10.1016/j.pharmthera.2020.107674. Epub 2020 Sep 8. Pharmacol Ther. 2021. PMID: 32910934 Free PMC article. Review.
-
The effect of acute social isolation on neural molecular responses in components of the social decision-making network.BMC Genomics. 2024 Aug 8;25(1):771. doi: 10.1186/s12864-024-10653-z. BMC Genomics. 2024. PMID: 39118023 Free PMC article.
-
Dynamic microRNA gene transcription and processing during T cell development.J Immunol. 2012 Apr 1;188(7):3257-67. doi: 10.4049/jimmunol.1103175. Epub 2012 Feb 29. J Immunol. 2012. PMID: 22379031 Free PMC article.
-
Differential transcriptomic alterations in nasal versus lung tissue of acrolein-exposed rats.Front Toxicol. 2023 Nov 27;5:1280230. doi: 10.3389/ftox.2023.1280230. eCollection 2023. Front Toxicol. 2023. PMID: 38090360 Free PMC article.
References
-
- Auphan N, DiDonato JA, Rosette C, Helmberg A, Karin M. Immunosuppression by glucocorticoids: Inhibition of NF-kappaB activity through induction of I kappaB synthesis. Science. 1995;270:286–290. - PubMed
-
- Bailey TL, Gribskov M. Combining evidence using P-values: Application to sequence homology searches. Bioinformatics. 1998;14:48–54. - PubMed
-
- Balsalobre A, Brown SA, Marcacci L, Tronche F, Kellendonk C, Reichardt HM, Schutz G, Schibler U. Resetting of circadian time in peripheral tissues by glucocorticoid signaling. Science. 2000;289:2344–2347. - PubMed
Publication types
MeSH terms
Substances
Grants and funding
LinkOut - more resources
Full Text Sources
Other Literature Sources