. 2010 Feb;30(2):286-98.
doi: 10.1038/jcbfm.2009.208. Epub 2009 Sep 30.

Brain-derived neurotrophic factor enhances the expression of the monocarboxylate transporter 2 through translational activation in mouse cultured cortical neurons

Affiliations

Brain-derived neurotrophic factor enhances the expression of the monocarboxylate transporter 2 through translational activation in mouse cultured cortical neurons

Camille Robinet et al. J Cereb Blood Flow Metab. 2010 Feb.

Abstract

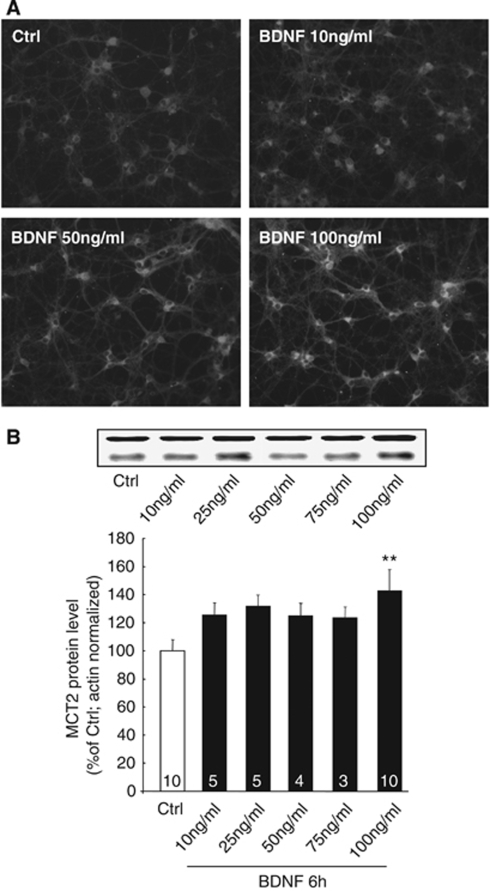
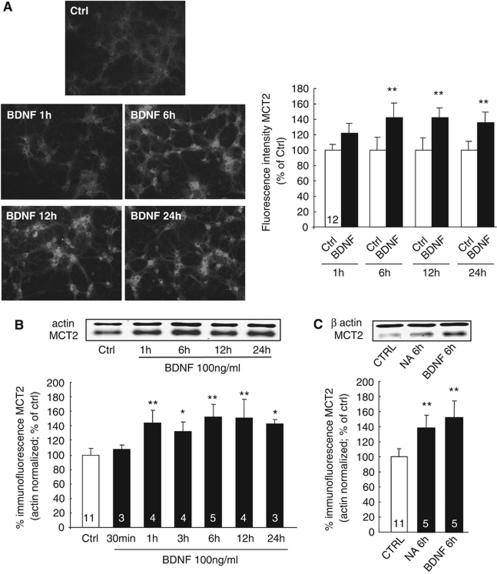
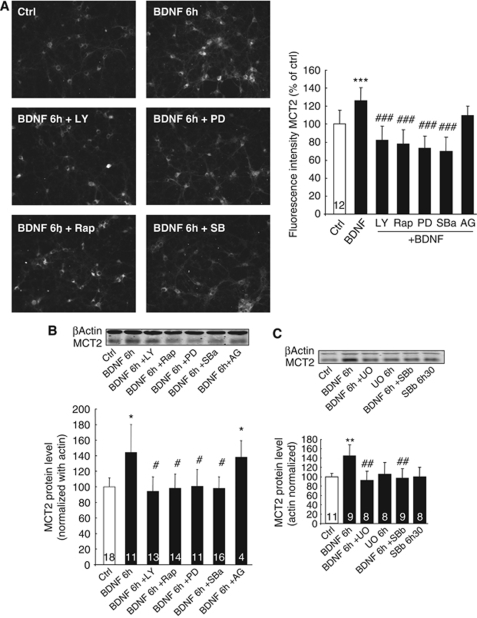
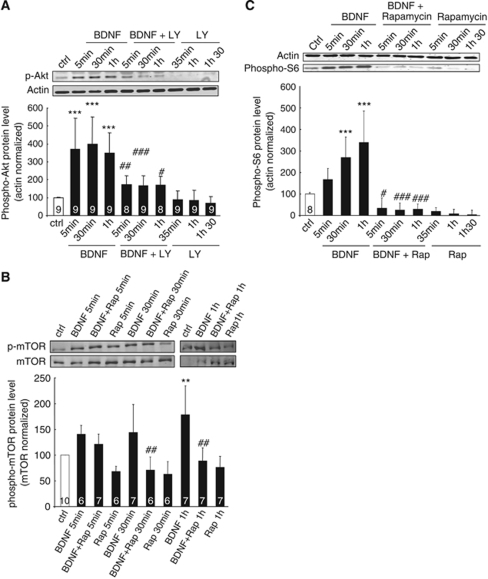
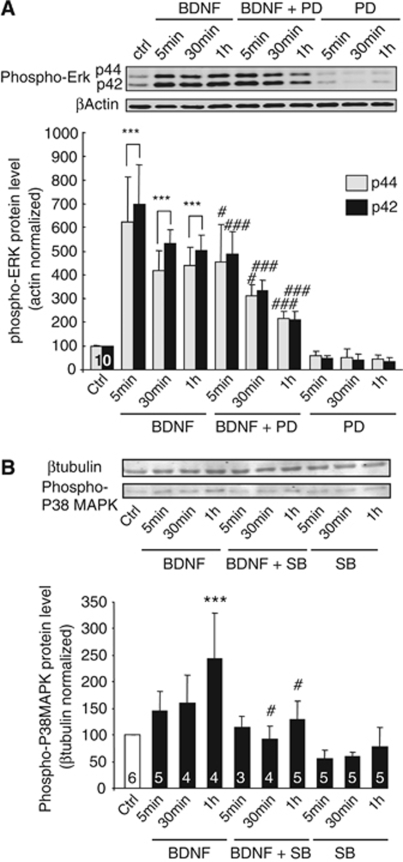
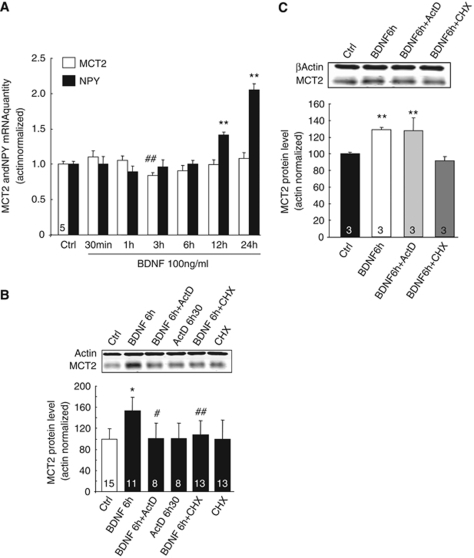
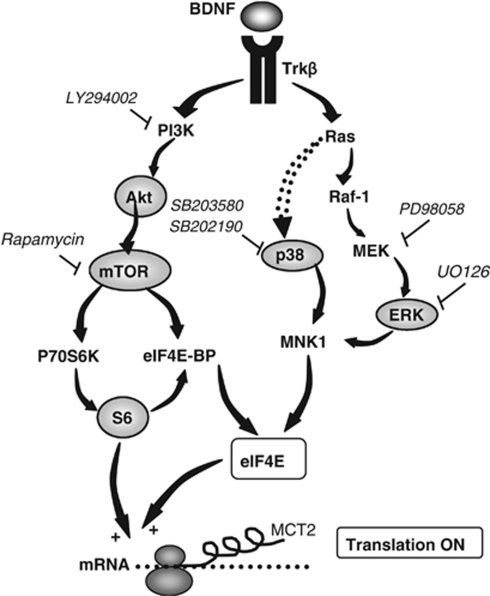
MCT2 is the predominant neuronal monocarboxylate transporter allowing lactate use as an alternative energy substrate. It is suggested that MCT2 is upregulated to meet enhanced energy demands after modifications in synaptic transmission. Brain-derived neurotrophic factor (BDNF), a promoter of synaptic plasticity, significantly increased MCT2 protein expression in cultured cortical neurons (as shown by immunocytochemistry and western blot) through a translational regulation at the synaptic level. Brain-derived neurotrophic factor can cause translational activation through different signaling pathways. Western blot analyses showed that p44/p42 mitogen-activated protein kinase (MAPK), Akt, and S6 were strongly phosphorylated on BDNF treatment. To determine by which signal transduction pathway(s) BDNF mediates its upregulation of MCT2 protein expression, the effect of specific inhibitors for p38 MAPK, phosphoinositide 3-kinase (PI3K), mammalian target of rapamycin (mTOR), mitogen-activated protein kinase (MAPK)/extracellular signal-regulated kinase (ERK) kinase (MEK), p44/p42 MAPK (ERK), and Janus kinase 2 (JAK2) was evaluated. It could be observed that the BDNF-induced increase in MCT2 protein expression was almost completely blocked by all inhibitors, except for JAK2. These data indicate that BDNF induces an increase in neuronal MCT2 protein expression by a mechanism involving a concomitant stimulation of PI3K/Akt/mTOR/S6, p38 MAPK, and p44/p42 MAPK. Moreover, our observations suggest that changes in MCT2 expression could participate in the process of synaptic plasticity induced by BDNF.


Figures

Figure 1
Figure 1
Concentration-dependent effect of BDNF on MCT2 expression in primary cultures of mouse cortical neurons. (A) Immunocytochemical stainings for MCT2 in untreated cultures (Ctrl) and in cultures treated with BDNF for 6 h at different concentrations. (B) Western blot analysis of MCT2 expression in primary cultures of mouse cortical neurons treated with BDNF for 6 h at various concentrations up to 100 ng/mL. Western blots were quantified using Odyssey software (LI-COR Biosciences, Lincoln, NE, USA). Results were expressed as percentage of control after the values were normalized using β-actin signal as the reference. Statistical analysis was performed using ANOVA followed by Dunnett's test. ** indicates MCT2 protein levels significantly different from control with P<0.01. Numbers in the graph bars represent the number of independent experiments for each condition.
Figure 2
Figure 2
Time course of the effect of BDNF on MCT2 protein expression in primary cultures of mouse cortical neurons. (A) MCT2 IR and related quantification of primary cultures of mouse cortical neurons treated with BDNF at a final concentration of 100 ng/mL for various periods of time up to 24 h (1, 6, 12, and 24 h). Left panels represent immunocytochemical stainings for MCT2 in untreated cultures (Ctrl) or cultures treated with BDNF for 6 h. The bar graph represents the quantitative determination of fluorescence intensity corresponding to MCT2 IR in cultured neurons treated with BDNF for various periods of time up to 24 h. Results are expressed as percentage of control fluorescence intensity and are represented as the mean±s.e.m. of independent determinations (numbers indicated on bars) from four distinct experiments. The value of fluorescence intensity for each determination represents the average level from 24 cells on the same coverslip. (B and C) Western blot analysis of MCT2 protein expression in cultures of mouse cortical neurons treated with BDNF 100 ng/mL or noradrenaline 100 μmol/L (NA 6 h) for the indicated times as compared with untreated cells (Ctrl). Western blots were quantified using Odyssey software (LI-COR Biosciences, Lincoln, NE, USA). Results are expressed as percentage of control (mean±s.e.m.) after the values had been normalized using β-actin signal as the reference. Statistical analysis was performed using ANOVA followed by Dunnett's test. *P<0.05, **P<0.01, ***P<0.001 versus control (Ctrl) for MCT2 protein levels. Numbers in the graph bars represent the number of independent experiments for each condition.
Figure 3
Figure 3
Effect of different signaling pathway inhibitors on BDNF-stimulated MCT2 expression in primary cultures of mouse cortical neurons. Primary cultures of mouse cortical neurons were pretreated for 30 mins with specific signaling pathway inhibitors (PD98095, 50 μmol/L (PD); SB202190, 10 μmol/L (SBa); LY294002, 10 μmol/L (LY); rapamycin, 20 ng/mL (Rap); AG490 25 μmol/L (AG); UO126, 10 μmol/L (UO); SB203580, 10 μmol/L (SBb)) before stimulation with BDNF 100 ng/mL for 6 h (BDNF 6 h). (A) Left panels represent immunocytochemical stainings for MCT2 in untreated cells (Ctrl), cultures treated with BDNF alone for 6 h (BDNF), or pretreated for 30 mins with each inhibitor (LY, Rap, PD, SBa) before the addition of BDNF. The bar graph represents the quantitative determination of fluorescence intensity corresponding to MCT2 IR in cultured neurons treated with the specific signaling pathway inhibitors followed by exposure to BDNF for 6 h. Results are expressed as percentage of control fluorescence intensity and represent the mean±s.e.m. of independent determinations (numbers indicated on bars) from four distinct experiments. The value of fluorescence intensity for each determination represents the average level from 24 cells on the same coverslip. (B and C) Western blot analysis of MCT2 expression in cultures of mouse cortical neurons treated with specific signaling pathway inhibitors (+LY, Rap, PD, SBa, AG, UO, SBb) before stimulation with BDNF 100 ng/mL for 6 h (BDNF 6 h). Western blots were quantified using Odyssey software (LI-COR Biosciences, Lincoln, NE, USA). Results are expressed as percentage of control (mean±s.e.m.) after the values had been normalized using β-actin signal as the reference. Statistical analysis was performed using ANOVA followed by Bonferroni's test. *P<0.05, **P<0.01 versus control (Ctrl). #P<0.05 versus 6 h BDNF treatment. Numbers in the graph bars represent the number of independent experiments for each condition.
Figure 4
Figure 4
Effect of BDNF on the phosphorylation levels of Akt, mTOR, and S6 in cultured mouse cortical neurons. Western blot analysis of phospho-Akt (A), phospho-mTOR (B), and phospho-S6 (C) levels in cultures of mouse cortical neurons treated with BDNF 100 ng/mL for the indicated times as compared with untreated cells (ctrl). (Panel A) LY294002, a specific PI3K inhibitor, was added to the culture medium at the concentration of 10 μmol/L, 30 mins before incubation with BDNF 100 ng/mL during 5 mins, 30 mins, and 1 h. Western blots were quantified using Odyssey software (LI-COR Biosciences, Lincoln, NE, USA). Results are expressed as percentage of control after the values had been normalized using β-actin signal as the reference. (Panels B and C) Rapamycin, a specific mTOR inhibitor, was added to the culture medium at a concentration of 20 ng/mL, 30 mins before incubation with BDNF 100 ng/mL. Results are expressed as percentage of control after the values had been normalized using either β-actin signal (panel C) or mTOR signal (panel B) as the reference. Statistical analysis was performed using ANOVA followed by Bonferroni's test. **, *** indicates phospho-Akt, phospho-mTOR, or phospho-S6 protein levels significantly different from control with P<0.01, P<0.001 respectively. #, ##, ### indicates phospho-Akt, phospho-mTOR, or phospho-S6 protein levels significantly different from the BDNF-treated condition with P<0.05, P<0.01, and P<0.001, respectively. Numbers in the graph bars represent the number of independent experiments for each condition.
Figure 5
Figure 5
Effect of BDNF on the phosphorylation levels of ERK and p38 MAPK in cultured mouse cortical neurons. Western blot analysis of phospho-ERK (A) and phospho-p38 MAPK (B) levels in cultures of mouse cortical neurons treated with BDNF 100 ng/mL for the indicated times as compared with untreated cells (ctrl). (Panel A) PD98058, a specific MEK inhibitor, was added to the culture medium at a concentration of 50 μmol/L, 30 mins before incubation with BDNF 100 ng/mL during 5 mins, 30 mins, and 1 h. (Panel B) SB202190, a specific p38 MAPK inhibitor, was added to the culture medium at a concentration of 10 μmol/L, 30 mins before incubation with BDNF 100 ng/mL. Western blots were quantified using Odyssey software (LI-COR Biosciences, Lincoln, NE, USA). Results are expressed as percentage of control after the values had been normalized using β-actin signal as reference. Statistical analysis was performed using ANOVA followed by Bonferroni's test. *** indicates phospho-ERK or phospho-p38 MAPK levels significantly different from control with P<0.001. ##, ### indicates phospho-ERK or phospho-p38 MAPK levels significantly different from BDNF-treated condition with P<0.01 and P<0.001, respectively. Numbers in the graph bars represent the number of independent experiments for each condition.
Figure 6
Figure 6
Synaptic regulation of MCT2 protein synthesis by BDNF. (A) Primary cultures of mouse cortical neurons were treated with BDNF 100 ng/mL for various periods of time. Neuronal cultures were harvested, and total RNA was extracted and analyzed for MCT2 and NPY mRNA expression by quantitative real-time RT-PCR. Results are expressed as percentages of control (mean±s.d.) after the values had been normalized using β-actin gene as the internal reference and were expressed as a relative mRNA quantity compared with control. Five independent experiments were pooled after performing quantitative RT-PCR. (B) Western blot analysis of MCT2 expression in primary cultures of mouse cortical neurons exposed to either actinomycin D (ActD) or cycloheximide (CHX) for 30 mins before the application of 100 ng/mL BDNF for 6 h. (C) Western blot analysis of MCT2 expression in synaptoneurosomes treated with BDNF 100 ng/mL in the presence or absence of ActD or CHX. Western blots were quantified using the Odyssey Infrared Imaging System (LI-COR Biosciences, Lincoln, NE, USA). Results are expressed as percentage of control after the values had been normalized using β-actin signal as the reference. Statistical analysis was performed using ANOVA followed by Bonferonni's test. *,** indicate MCT2 protein levels significantly different from control with P<0.05 and P<0.01. #, ## indicate MCT2 protein levels significantly different from BDNF-treated condition with P<0.05 and P<0.01, respectively. Numbers in the graph bars represent the number of independent experiments for each condition.
Figure 7
Figure 7
Putative signaling pathways leading to translational activation and enhanced MCT2 protein synthesis after BDNF treatment in cultured cortical neurons. BDNF and TrkB can activate distinct signal transduction pathways involving specific kinases leading to translation initiation. Two pathways investigated in this study are illustrated herein (PI3K/Akt/mTOR/S6 and MAPK signaling pathways). The surrounding proteins were directly investigated for their level of phosphorylation. First, phosphorylation of PI3K can cause the phosphorylation and activation of Akt, which then directly phosphorylates mTOR, which in turn phosphorylates p70S6K. The target of p70S6K, the ribosomal S6 protein, once phosphorylated, participates in the translational machinery as part of the 40S complex. Second, the MAPK cascade is also activated by BDNF requiring the activation of MEK. MEK phosphorylates the p44 and p42 MAPK, which can activate, among others, MNK1. When activated, MNK1 phosphorylates eIF4E on Ser209 that correlates with enhanced rates of translation of capped mRNA. Specific inhibitors for some kinases have been used to distinguish the implication of each pathway in the effect of BDNF: LY294002, PI3K inhibitor; rapamycin, mTOR inhibitor; PD98058, MEK inhibitor; SB202190 and SB203580, p38 MAPK inhibitors.

Similar articles

Cited by

References

    1. Almeida RD, Manadas BJ, Melo CV, Gomes JR, Mendes CS, Graos MM, Carvalho RF, Carvalho AP, Duarte CB. Neuroprotection by BDNF against glutamate-induced apoptotic cell death is mediated by ERK and PI3-kinase pathways. Cell Death Differ. 2005;12:1329–1343. - PubMed
    1. Bergersen L, Rafiki A, Ottersen OP. Immunogold cytochemistry identifies specialized membrane domains for monocarboxylate transport in the central nervous system. Neurochem Res. 2002;27:89–96. - PubMed
    1. Bergersen LH, Magistretti PJ, Pellerin L. Selective postsynaptic co-localization of MCT2 with AMPA receptor GluR2/3 subunits at excitatory synapses exhibiting AMPA receptor trafficking. Cereb Cortex. 2005;15:361–370. - PubMed
    1. Blichenberg A, Schwanke B, Rehbein M, Garner CC, Richter D, Kindler S. Identification of a cis-acting dendritic targeting element in MAP2 mRNAs. J Neurosci. 1999;19:8818–8829. - PMC - PubMed
    1. Bliss TM, Ip M, Cheng E, Minami M, Pellerin L, Magistretti P, Sapolsky RM. Dual-gene, dual-cell type therapy against an excitotoxic insult by bolstering neuroenergetics. J Neurosci. 2004;24:6202–6208. - PMC - PubMed

Publication types

MeSH terms

Substances

LinkOut - more resources