

FXR activation reverses insulin resistance and lipid abnormalities and protects against liver steatosis in Zucker (fa/fa) obese rats
- PMID: 19783811
- PMCID: PMC2842143
- DOI: 10.1194/jlr.M001602
FXR activation reverses insulin resistance and lipid abnormalities and protects against liver steatosis in Zucker (fa/fa) obese rats
Abstract
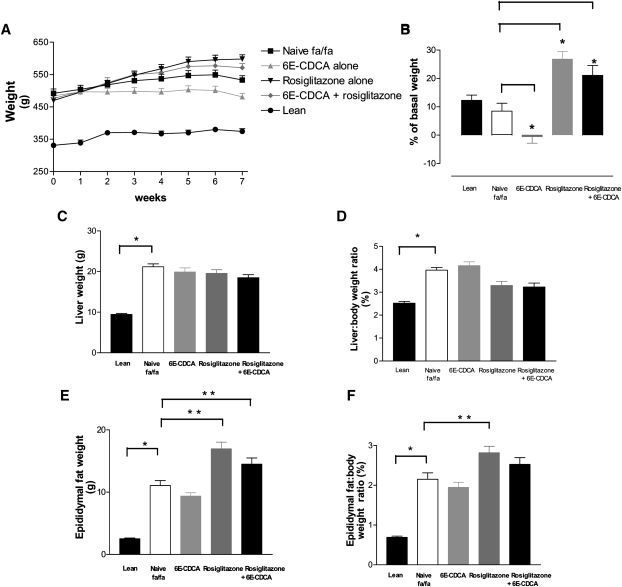
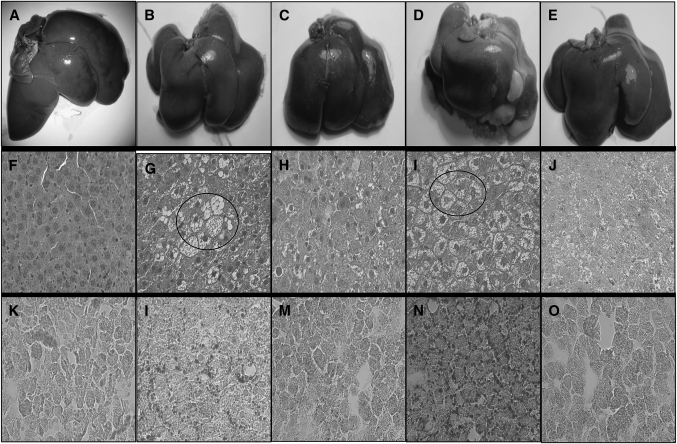
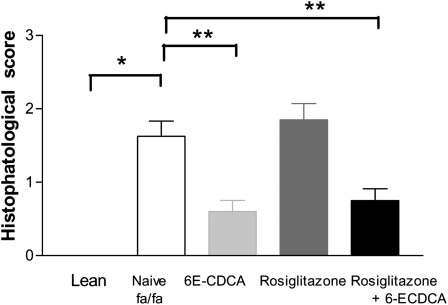
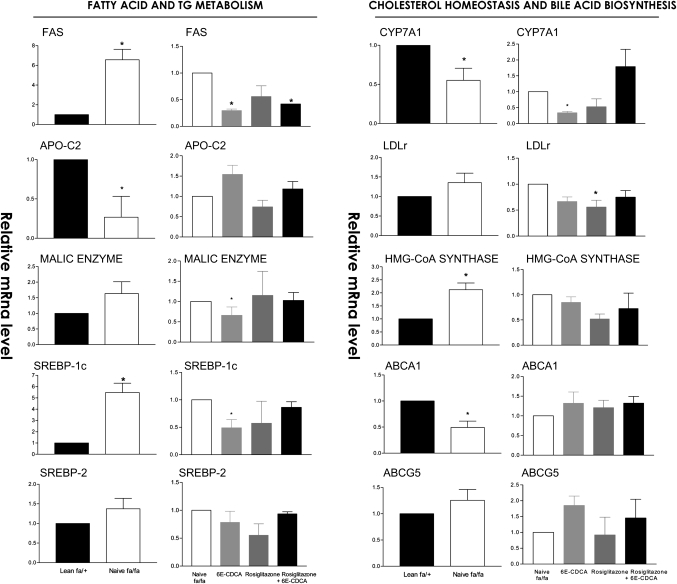
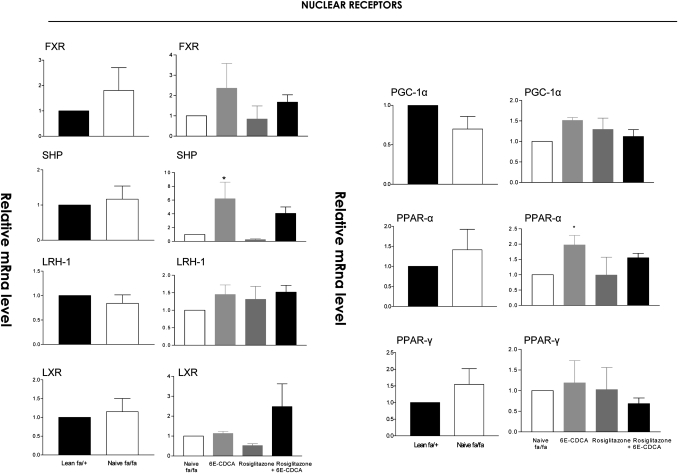
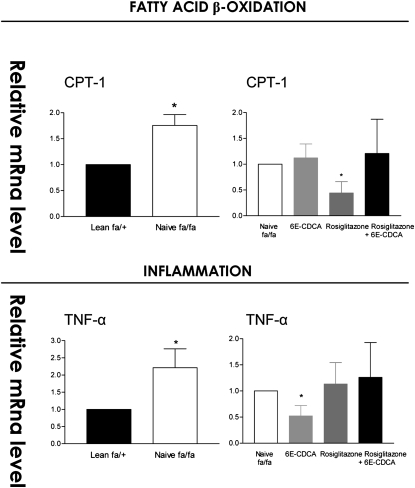
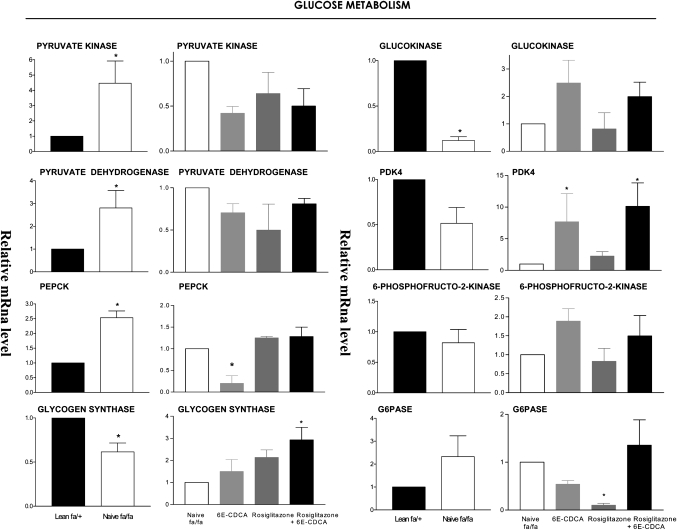
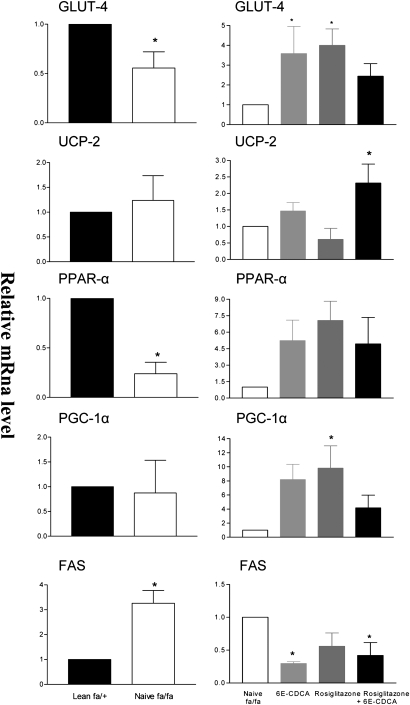
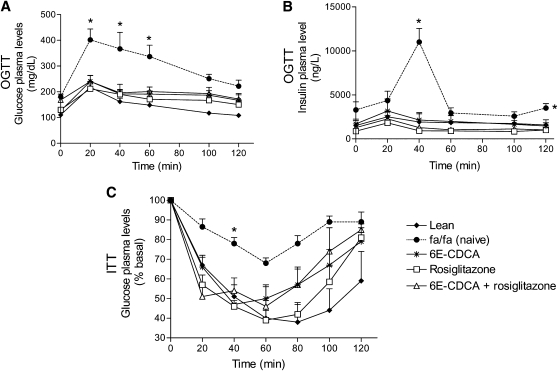
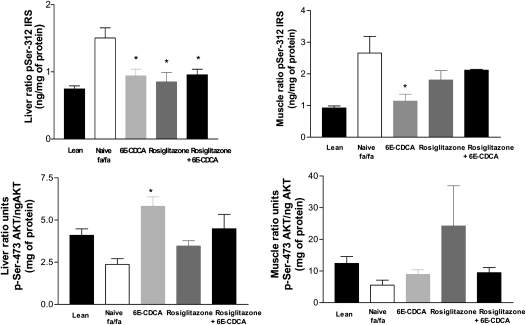
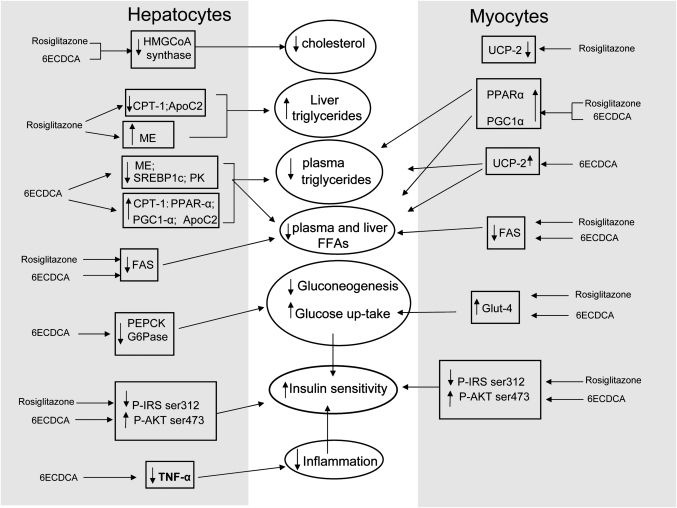
The farnesoid X receptor (FXR) is a bile acid activated nuclear receptor. Zucker (fa/fa) rats, harboring a loss of function mutation of the leptin receptor, develop diabetes, insulin resistance, obesity, and liver steatosis. In this study, we investigated the effect of FXR activation by 6-ethyl-chenodeoxycholic acid, (6E-CDCA, 10 mg/kg) on insulin resistance and liver and muscle lipid metabolism in fa/fa rats and compared its activity with rosiglitazone (10 mg/kg) alone or in combination with 6E-CDCA (5 mg/kg each). In comparison to lean (fa/+), fa/fa rats on a normal diet developed insulin resistance and liver steatosis. FXR activation protected against body weight gain and liver and muscle fat deposition and reversed insulin resistance as assessed by insulin responsive substrate-1 phosphorylation on serine 312 in liver and muscles. Activation of FXR reduced liver expression of genes involved in fatty acid synthesis, lipogenesis, and gluconeogenesis. In the muscles, FXR treatment reduced free fatty acid synthesis. Rosiglitazone reduced blood insulin, glucose, triglyceride, free fatty acid, and cholesterol plasma levels but promoted body weight gain (20%) and liver fat deposition. FXR activation reduced high density lipoprotein plasma levels. In summary, FXR administration reversed insulin resistance and correct lipid metabolism abnormalities in an obesity animal model.
Figures
Similar articles
-
FXR activation improves myocardial fatty acid metabolism in a rodent model of obesity-driven cardiotoxicity.Nutr Metab Cardiovasc Dis. 2013 Feb;23(2):94-101. doi: 10.1016/j.numecd.2011.06.008. Epub 2011 Sep 15. Nutr Metab Cardiovasc Dis. 2013. PMID: 21924881
-
Synthetic FXR agonist GW4064 prevents diet-induced hepatic steatosis and insulin resistance.Pharm Res. 2013 May;30(5):1447-57. doi: 10.1007/s11095-013-0986-7. Epub 2013 Feb 1. Pharm Res. 2013. PMID: 23371517 Free PMC article.
-
Yangonin protects against non-alcoholic fatty liver disease through farnesoid X receptor.Phytomedicine. 2019 Feb;53:134-142. doi: 10.1016/j.phymed.2018.09.006. Epub 2018 Sep 5. Phytomedicine. 2019. PMID: 30668392
-
Use of farnesoid X receptor agonists to treat nonalcoholic fatty liver disease.Dig Dis. 2015;33(3):426-32. doi: 10.1159/000371698. Epub 2015 May 27. Dig Dis. 2015. PMID: 26045279 Review.
-
A Short Review on Obeticholic Acid: An Effective Modulator of Farnesoid X Receptor.Curr Rev Clin Exp Pharmacol. 2024;19(3):225-233. doi: 10.2174/0127724328239536230919070001. Curr Rev Clin Exp Pharmacol. 2024. PMID: 38708917 Review.
Cited by
-
Non-alcoholic Fatty liver disease: the bile Acid-activated farnesoid x receptor as an emerging treatment target.J Lipids. 2012;2012:934396. doi: 10.1155/2012/934396. Epub 2011 Dec 7. J Lipids. 2012. PMID: 22187656 Free PMC article.
-
Recent advances in the development of farnesoid X receptor agonists.Ann Transl Med. 2015 Jan;3(1):5. doi: 10.3978/j.issn.2305-5839.2014.12.06. Ann Transl Med. 2015. PMID: 25705637 Free PMC article. Review.
-
Nuclear receptors reverse McGarry's vicious cycle to insulin resistance.Cell Metab. 2012 May 2;15(5):615-22. doi: 10.1016/j.cmet.2012.03.016. Cell Metab. 2012. PMID: 22560214 Free PMC article.
-
Proglumide Reverses Nonalcoholic Steatohepatitis by Interaction with the Farnesoid X Receptor and Altering the Microbiome.Int J Mol Sci. 2022 Feb 8;23(3):1899. doi: 10.3390/ijms23031899. Int J Mol Sci. 2022. PMID: 35163821 Free PMC article.
-
Metabolic Effects of Bile Acids: Potential Role in Bariatric Surgery.Cell Mol Gastroenterol Hepatol. 2019;8(2):235-246. doi: 10.1016/j.jcmgh.2019.04.014. Epub 2019 May 7. Cell Mol Gastroenterol Hepatol. 2019. PMID: 31075353 Free PMC article. Review.
References
-
- Varela-Rey M., Embade N., Ariz U., Lu S. C., Mato J. M., Martìnez-Chantar M. L. 2009. Non-alcoholic steatohepatitis and animal models: understanding the human disease. Int. J. Biochem. Cell Biol. 41: 969–976 - PubMed
-
- Kanety H., Feinstein R., Papa M. Z., Hemi R., Karasik A. 1995. Tumor necrosis factor alpha-induced phosphorylation of insulin receptor substrate-1 (IRS-1). Possible mechanism for suppression of insulin stimulated tyrosine phosphorylation of IRS-1. J. Biol. Chem. 270: 23780–23784 - PubMed
-
- Paz K., Hemi R., Leroith D., Karasik A., Elhanany E., Kanety H., Zick Y. 1997. A molecular basis for insulin resistance. Elevated serine threonine phosphorylation of IRS-1 and IRS-2 inhibits their binding to the juxtamembrane region of the insulin receptor and impairs their ability to undergo insulin-induced tyrosine phosphorylation. J. Biol. Chem. 272: 29911–29918 - PubMed
Publication types
MeSH terms
Substances
LinkOut - more resources
Full Text Sources
Other Literature Sources
Medical
