. 2009 Sep 15;2(88):ra53.
doi: 10.1126/scisignal.2000368.

Tks5-dependent, nox-mediated generation of reactive oxygen species is necessary for invadopodia formation

Affiliations

Tks5-dependent, nox-mediated generation of reactive oxygen species is necessary for invadopodia formation

Begoña Diaz et al. Sci Signal. .

Abstract

Invadopodia are actin-rich membrane protrusions of cancer cells that facilitate pericellular proteolysis and invasive behavior. We show here that reactive oxygen species (ROS) generated by the NADPH (reduced form of nicotinamide adenine dinucleotide phosphate) oxidase (Nox) system are necessary for invadopodia formation and function. Knockdown of the invadopodia protein Tks5 [tyrosine kinase substrate with five Src homology 3 (SH3) domains], which is structurally related to the Nox component p47(phox), reduces total ROS abundance in cancer cells. Furthermore, Tks5 and p22(phox) can associate with each other, suggesting that Tks5 is part of the Nox complex. Tyrosine phosphorylation of Tks5 and Tks4, but not other Src substrates, is reduced by Nox inhibition. We propose that Tks5 facilitates the production of ROS necessary for invadopodia formation, and that in turn ROS modulate Tks5 tyrosine phosphorylation in a positive feedback loop.


Figures
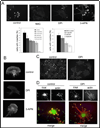
Figure 1
Figure 1. ROS are required for invadopodia and podosome formation
Panel A. NAC and DPI inhibit invadopodia formation in Src-3T3 cells. Src-3T3 cells were plated onto coverslips, treated with vehicle (DMSO), NAC (10mM), DPI (20µM) and 3-APN (300µM), and processed for F-actin staining. Representative images (63×) are shown on the top. On the bottom, a dose response to NAC and DPI was performed and the quantitation of rosettes of invadopodia in least 150 cells per experimental point is shown. Panel B. DPI inhibits podosome formation in macrophages. IC-21 cells were incubated with vehicle (control, top), 20µM DPI (middle) or 300µM 3-APN (bottom) and stained with phalloidin to visualize podosomes. Panel C. DPI reduces F-actin content. Src-3T3 cells treated with vehicle (control, left) or 20µM DPI (right) were incubated with 0.05 U/ml phalloidin and images captured with the same exposure time. Panel D. FAK localization is affected by DPI treatment. Control and 20µM DPI-treated Src-3T3 cells were stained with antibodies to FAK or with phalloidin.
Figure 2
Figure 2. ROS are required for gelatin degradation and invasion, and ROS are localized to invadopodia
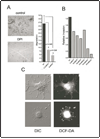
Panel A. DPI inhibits gelatin degradation. Src-3T3 cells were plated on fluorescently labeled gelatin coated coverslips and treated with 20µM DPI 1.5h later. Cells were cultured for additional 5.5h after treatment and processed for F-actin staining. A representative image (obtained from an area containing comparable numbers of cells) of the gelatin degradation is shown on the left (40×), and the quantitation of one representative experiment from three is shown on the right. Panel B. NAC and DPI inhibit matrigel invasion. Src-3T3 cells were treated with the indicated inhibitors and assayed for matrigel invasion as described in Materials and Methods. Panel C. Some ROS localize to invadopodia Src-3T3 cells were incubated with the ROS probe CM-DCF-DA and visualized under differential interference (DIC) or fluorescence (DCF-DA) microscopy.
Figure 3
Figure 3. The NADPH oxidase system is involved in invadopodia formation and function in Src-3T3 cells
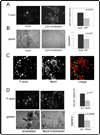
Panel A. Knockdown of p22phox reduces invadopodia number. Src-3T3 cells were treated with transfection reagent alone (mock) or with a pool of p22phox siRNAs (p22 knockdown) and assayed for invadopodia formation. Representative images are shown on the left (F-actin staining at 63×), and quantitation of at least 150 cells per experimental point on the right. The experiment was repeated three times with similar results. Panel B. Knockdown of p22phox reduces gelatin degradation. Src-3T3 cells were treated with transfection reagent alone (mock) of a mixture of p22phox siRNAs (p22 knockdown) and assayed for gelatin degradation. Representative images obtained at 40× from areas of similar cell density are shown on the left, and quantitation of at least 150 cells per experimental point on the right. Panel C. Nox4 localizes to invadopodia. Src-3T3 cells were fixed and stained with fluorescently-conjugated phalloidin (green) or with an antibody specific for Nox4 (red), and processed for confocal microscopy. Arrowheads point to rosettes showing co-localization of F-actin and Nox4. A merged image is shown on the right. Panel D. Nox4 is required for invadopodia formation and gelatin degradation. Src-3T3 cells were infected with lentiviruses expressing either a control (scrambled) or Nox4 shRNA (Nox4 knockdown) and assayed for invadopodia formation or gelatin degradation Representative images are shown (top, 60× for F-actin staining; bottom, 40× for labeled gelatin on areas with similar cell density). Quantitation of at least 150 cells per experimental condition are shown at the right. The experiment was repeated three times for invadopodia detection, and twice for gelatin degradation with similar results.
Figure 4
Figure 4. Nox-generated ROS are required for invadopodia formation and function in human cancer cells
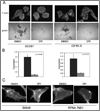
Panel A. DPI inhibits invadopodia formation and gelatin degradation in the human cancer cell lines SCC61 and C8161.9. Cancer cells were grown on gelatin-coated coverslips, treated with DMSO or 20µM DPI, then assayed for invadopodia formation (F-actin) and gelatin degradation (gelatin). Panel B. Quantitation of gelatin degradation. Quantitation of the gelatin degradation at least 50 SCC61 (left) and C8161.9 (right) cells are shown. Panel C. DPI inhibits invadopodia formation in BT549 and RPMI-7951 cells. Cancer cells were grown on gelatin-coated coverslips, treated with DMSO or 20µM DPI, then assayed for invadopodia formation (F-actin).
Figure 5
Figure 5. NADPH oxidases are required for invadopodia formation and function
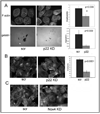
Panel A. Knockdown of p22phox reduces invadopodia number and FITC-gelatin degradation in SCC61 cells. SCC61 cells were transfected with scrambled control (scr) or a p22 siRNA (p22 KD) and assayed for invadopodia formation (F-actin) and gelatin degradation (gelatin). Representative images are shown on the left. Quantitation of at least 150 cells is shown on the right. Panel B. Knockdown of p22phox reduces invadopodia number in C8161.9 cells. C8161.9 cells were infected with scrambled control (scr) or a p22 shRNA (p22 KD) and assayed for invadopodia formation (F-actin). Representative images are shown on the left. Quantitation of at least 150 cells is shown on the right. Panel C. Nox4 is required for invadopodia formation in C8161.9 cells. C8161.9 cells were transfected with scrambled (scr) or Nox4-specific siRNAs and assayed for invadopodia formation. No invadopodia were detected in any Nox4 knockdown cells.
Figure 6
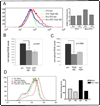
Figure 6. Tks5 is required for ROS production
Panel A. Tks5 knockdown reduces ROS in Src-3T3 cells as measured by DCF-DA. 3T3 and Src-3T3 cells were infected with control (Scr) or Tks5-specific shRNAs, incubated with CM-DCF-DA and analyzed on by FACS (left). ROS level quantitation is shown on the right. Knockdown of Tks5 levels is shown in Supplementary Figure 5. Panel B. Tks5 knockdown reduces ROS levels in Src-3T3 cells as measured by luminol chemiluminescence. Src-3T3 cells were transfected with control (scr), Tks5 (Tks5 KD) or p22phox (p22 KD) specific siRNAs, and ROS levels quantitated by a luminol-based chemoluminescence assay. Knockdown of p22phox and Tks5 is shown in Supplementary Figures 4 and 5 respectively. Panel C. Tks5 knockdown reduces ROS levels in SCC61 cells as measured by luminol chemiluminescence. SCC61 cells were transfected with control (scr) or a pool of Tks5 specific siRNAs (Tks5 KD). One hour before the assay, the control cells were incubated with either DMSO or 20µM DPI, and ROS levels were then quantitated by a luminol-based chemoluminescence assay. The degree of knockdown of Tks5 is shown in Supplementary Figure 5. Panel D. Nox4-mediated ROS production requires Tks5. B16-F10 melanoma cells were infected with lentiviruses expressing scrambled or Tks5-specific shRNAs, and transfected with cDNAs for Nox4 and p22 24 hours later. 48 hours after transfection cells were incubated with CM-DCF-DA and ROS levels determined by FACS. Quantitation of ROS levels is shown on the right, and analysis of Tks5, Nox4 and p22 levels in Supplementary Figure 5.
Figure 7
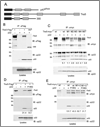
Figure 7. Tks5 and p22phox can associate
Panel A. Schematic of Tks5, p47phox, and the Tks5 truncation mutant 390. Panel B. Co-transfection of Tks5 and p22phox. 293T cells were transfected with the indicated plasmids, lysed and processed for immunoprecipitation and immunoblotting with the antibodies shown. The upper panel shows the immunoprecipitation and immunoblotting of Tks5, the lower panel shows the level of p22phox in whole cell lysates, and the middle panel is an immunoblot of Tks5 immunoprecipitates with p22 antibody, to probe for Tks5/p22 association. Panel C. Analysis of Tks5 mutants Tks5 mutants containing point mutations in the ligand binding surface of each SH3 domain (M1–M5) were tested for p22phox association as described in panel A. The numbers at the base of the middle panel are the relative pixel density for the p22phox bands. Panel D. Analysis of p22phox mutants. Wild-type and P156Q versions of p22phox were tested for their ability to bind Tks5. The numbers at the base of the middle panel are the relative pixel density for the p22phox bands. Panel E. Analysis of combination of Tks5 and p22phox mutants The numbers at the base of the middle panel are the relative pixel density for the p22phox bands.
Figure 8
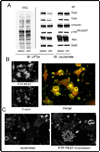
Figure 8. ROS effects on tyrosine phosphorylation
Panel A. Comparison of tyrosine phosphorylation levels of various Src substrates Src-3T3 cells were incubated with DMSO or DPI, then lysed and immunoprecipitated with the antibodies shown. Immunoblotting was conducted with anti-phosphotyrosine (αPTyr) antibodies on the lysates (WCL) on the left, and the immunoprecipitates in the middle panel. On the right, each immunoprecipitate was immunoblotted with cognate antibody to control for loading. Quantification of the relative phosphotyrosine levels by densitometry is shown in Supplementary Figure 6. Panel B. Localization of PTP-PEST to invadopodia Src-3T3 cells were stained with phalloidin, to visualize the F-actin, and an antibody specific for PTP-PEST, and analyzed by fluorescent microscopy. Panel C. Knockdown of PTP-PEST increases invadopodia number Src-3T3 cells were transfected with scrambled or PTP-PEST pooled siRNAs, along with a fluorescent reporter oligo, and stained with phalloidin 72 hours later. In both cases, the arrow indicates one cell positive for the reporter oligo, in a field of otherwise reporter-negative cells.

Similar articles

Cited by

References

    1. Linder S, Kopp P. Podosomes at a glance. J Cell Sci. 2005;118:2079. - PubMed
    1. Evans JG, Matsudaira P. Structure and dynamics of macrophage podosomes. Eur J Cell Biol. 2006;85:145. - PubMed
    1. Weaver AM. Invadopodia: specialized cell structures for cancer invasion. Clin Exp Metastasis. 2006;23:97. - PubMed
    1. Linder S. The matrix corroded: podosomes and invadopodia in extracellular matrix degradation. Trends Cell Biol. 2007;17:107. - PubMed
    1. Gimona M, Buccione R, Courtneidge SA, Linder S. Assembly and biological role of podosomes and invadopodia. Curr Opin Cell Biol. 2008;20:235. - PubMed

MeSH terms