. 2009 Sep 11;35(5):610-25.
doi: 10.1016/j.molcel.2009.08.020.

miR-24 Inhibits cell proliferation by targeting E2F2, MYC, and other cell-cycle genes via binding to "seedless" 3'UTR microRNA recognition elements

Affiliations

miR-24 Inhibits cell proliferation by targeting E2F2, MYC, and other cell-cycle genes via binding to "seedless" 3'UTR microRNA recognition elements

Ashish Lal et al. Mol Cell. .

Abstract

miR-24, upregulated during terminal differentiation of multiple lineages, inhibits cell-cycle progression. Antagonizing miR-24 restores postmitotic cell proliferation and enhances fibroblast proliferation, whereas overexpressing miR-24 increases the G1 compartment. The 248 mRNAs downregulated upon miR-24 overexpression are highly enriched for DNA repair and cell-cycle regulatory genes that form a direct interaction network with prominent nodes at genes that enhance (MYC, E2F2, CCNB1, and CDC2) or inhibit (p27Kip1 and VHL) cell-cycle progression. miR-24 directly regulates MYC and E2F2 and some genes that they transactivate. Enhanced proliferation from antagonizing miR-24 is abrogated by knocking down E2F2, but not MYC, and cell proliferation, inhibited by miR-24 overexpression, is rescued by miR-24-insensitive E2F2. Therefore, E2F2 is a critical miR-24 target. The E2F2 3'UTR lacks a predicted miR-24 recognition element. In fact, miR-24 regulates expression of E2F2, MYC, AURKB, CCNA2, CDC2, CDK4, and FEN1 by recognizing seedless but highly complementary sequences.


Figures
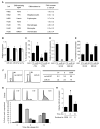
Fig. 1
Fig. 1
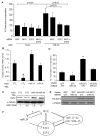
miR-24 is up-regulated during hematopoietic cell differentiation and inhibits cell proliferation (A) miR-24 expression, measured using qRT-PCR relative to untreated cells, increases in K562 cells differentiated to megakaryocytes or erythrocytes and HL60 cells differentiated to macrophages, monocytes and granulocytes. Differentiation in all experiments was verified by cell surface phenotype. Mature miR-24 levels were determined by qRT-PCR and normalized to U6. (B) miR-24 knockdown in K562 cells specifically decreases miR-24, assayed by qRT-PCR in cells transfected with miR-24 ASO (white) relative to control ASO (black). Expression relative to U6 snRNA is normalized to control cells. (C) miR-24 knockdown with ASO increases K562 cell proliferation measured by thymidine uptake, both in the presence and absence of TPA. The decline in proliferation with TPA is completely restored by antagonizing miR-24. (D, E) Knocking down miR-24 in WI-38 or IMR-90 cells also significantly increases proliferation as measured by thymidine incorporation 48 hr post-transfection. miR-24 knockdown by ASO measured by qRT-PCR is normalized to U6 snRNA. Error bars in (B-E) represent standard deviation from 3 experiments (**, p<0.01; ##, p<0.001). (F) miR-24 over-expression increases the G1 compartment in HepG2 cells. HepG2 cells transfected with miR-24 or control mimic for 48 hr were stained with propidium iodide and analyzed by flow cytometry. Representative analysis of 3 independent experiments is shown. (G) K562 cells, synchronized in G2/M by nocodazole and then released, were analyzed by flow cytometry. A representative experiment is shown in the top panel and the mean (±SD) percentage of cells in each phase of the cell cycle (from 3 independent experiments) below (G1, light grey; S, dark grey; G2/M, black). (H) qRT-PCR analysis of miR-24 (normalized to U6 snRNA) from the partially synchronized K562 cells in (G) shows that miR-24 is most highly expressed in G1 and declines as cells progress to S and G2/M phase. (#, p<0.005).
Fig. 2
Fig. 2
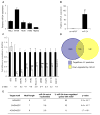
mRNA down-regulation after miR-24 over-expression (A) HepG2 cells express low levels of miR-24, assayed by qRT-PCR analysis normalized to U6, compared to HeLa, WI-38, HL60 and K562 cells. (B) Effective increase in miR-24 in HepG2 cells 48 hr after transfection with miR-24 mimic compared to cel-miR-67-transfected control cells. #, p<0.005. (C) Genes identified by microarray as down-regulated by miR-24 over-expression were confirmed to be down-regulated by qRT-PCR normalized to GAPDH. UBC is a housekeeping gene. Cells were transfected with cel-miR-67 (black) or miR-24 mimic (white). **, p<0.01; #, p<0.005, ##, p<0.001. The down-regulated genes are graphed in order of their down-regulation on the microarray; the Z-ratio of the microarray analysis is shown below. Error bars represent SD from 3 independent experiments (A, B and C). (D) Venn diagram of genes down-regulated by miR-24 in HepG2 cells and genes predicted to be regulated by miR-24 using TargetScan 4.2. Of the 100 predicted genes, whose mRNA is also significantly down-regulated, only 20 have conserved predicted miR-24 recognition sites. TargetScan 4.2 predicts 349 conserved miR-24 targets and many more that are not conserved. (E) Sites complementary to the miR-24 seed are enriched in the 3′UTR of down-regulated transcripts. The table shows the frequency of perfect hexamer (positions 2-7), heptamer (positions 2-8) and octamer (positions 2-9) miR-24 3′UTR seeds in the down-regulated genes.
Fig. 3
Fig. 3
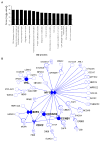
Bioinformatic analysis of miR-24 down-regulated genes suggests that miR-24 regulates cell cycle progression and DNA repair (A) Top 15 over-represented cellular processes for the 100 overlapping genes in Fig. 2D. Over-represented processes are sorted by Score (-log [p-value]). A highly positive score suggests that the subnetwork is highly saturated with genes identified experimentally and doesn't have many nodes not experimentally identified. The complete list of 100 genes in the overlap and further statistical analysis is provided in Suppl. Table 1 and 3. The dotted line represents the statistically significant limit. (B) Major direct interaction network of the 248 genes significantly down-regulated after transfection of HepG2 cells with miR-24 mimics. Nodes with at least 5 interactions (including auto-regulation) are highlighted (symbols: transcription factor, formula image; enzyme, formula image; kinase, formula image; ligand-dependent nuclear receptor, formula image; transporter, formula image; phosphatase, formula image; peptidase, formula image; translation regulator, formula image; other, ●).
Fig. 4
Fig. 4
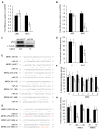
miR-24 regulates MYC expression. miR-24 over-expression in HepG2 (A) or K562 cells (B) decreases MYC mRNA, analyzed by qRT-PCR and normalized to GAPDH (black, cel-miR-67; white, miR-24). (C) MYC protein is decreased in K562 cells upon miR-24 over-expression. Densitometry was used to quantify protein; α-tubulin served as loading control. (D) miR-24 targets the MYC 3′UTR in a luciferase reporter assay. HepG2 cells were transfected with control miRNA (black) or miR-24 (white) mimic for 48 hr and then with MYC 3′UTR-luciferase reporter (MYC) or vector (V) for 24 hr. (E) Predicted binding sites in the MYC 3′UTR for miR-24 (MRE1-6) by rna22. The numbers in parenthesis correspond to the position in the MYC 3′UTR. Perfect matches are indicated by a line; G:U pairs by :. (F-H) miR-24 regulates MRE3 and MRE6 by luciferase reporter assay. HepG2 cells were co-transfected with cel-miR-67 (black) or miR-24 (white) mimics and luciferase reporters containing the wild type (wt) MRE1-6 in (E,F) or mutated (mt) MRE3 and MRE6 in (G,H) or vector (V). Luciferase activity was measured 48 hr after transfection. In (G), red letters denote point mutations that disrupt base pairing. Mean ± SD, normalized to vector control, of 3 independent experiments is shown. *, p<0.05; **, p< 0.01.
Fig. 5
Fig. 5
miR-24 over-expression downregulates E2Fs and some E2F-regulated genes (A) miR-24 significantly reduces mRNA levels of E2F1, E2F2 and E2F3 and of some E2F-target genes (RRM2, CHEK1, CCNA2, FEN1, MCM4, MCM10, CDC2, AURKB), but not BRCA1 and PCNA. CDK4, a key MYC target gene, is also down-regulated. HepG2 cells were transfected with miR-24 (white) or control mimics (black) for 48 hrs, and E2F and their target mRNAs were measured by qRT-PCR. Data normalized to GAPDH are expressed relative to control mimic-transfected cells. UBC is a control housekeeping gene. The Z-ratios refer to the significantly down-regulated mRNAs in the mRNA microarray in miR-24-over-expressing cells. (B) Protein expression of miR-24 target genes is substantially reduced in miR-24 mimic-transfected K562 cells 72 hr after transfection, relative to control miRNA-transfected cells. Densitometry was used to quantify protein relative to α-tubulin. HuR and α-tubulin are loading controls. (C) miR-24 levels significantly increased when K562 cells were transfected with 10 or 50 nM miR-24 mimics as measured by qRT-PCR analysis. Expression relative to U6 snRNA is depicted normalized to control cells. (D) A 4-fold increase in miR-24, obtained by transfecting 10 nM miR-24 mimic, reduces target proteins. Cell lysates of K562 cells, obtained 72 hr after transfection with indicated concentrations of control or miR-24 mimics, were analyzed by immunoblot. α-tubulin and HuR are loading controls. Error bars represent mean ± SD from 3 independent experiments. *, p<0.05, **, p<0.01; #, p<0.005.
Fig. 6
Fig. 6
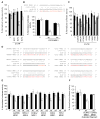
E2F2 and multiple E2F-target genes are direct targets of miR-24, recognized by “seedless” MREs. (A) miR-24 silences the expression of luciferase genes engineered with the 3′UTR of E2F2, but not with E2F1 or E2F3 3′UTRs, suggesting that E2F2 is a direct miR-24 target but E2F1 and E2F3 are down-regulated indirectly. Luciferase assays were performed in HepG2 cells over-expressing miR-24 (white) or control mimics (black). (B) miR-24 down-regulates luciferase activity of a reporter gene containing wild-type (wt) E2F2 MRE1. Mutations in the miR-24 pairing residues (mt) rescue luciferase expression (sequences and luciferase assays for candidate E2F2 wt 3′UTR MREs are shown in Suppl. Fig. 3). (C) miR-24 targets the 3′UTR of E2F-regulated genes (AURKB, BRCA1, CCNA2, CDC2, FEN1) and CDK4, a MYC-regulated gene. CHEK1 and PCNA 3′UTRs are not regulated by miR-24. HepG2 cells were co-transfected with a luciferase reporter containing the 3′UTR of the indicated gene and control miRNA (black) or synthetic miR-24 (white) for 48 hr. Expression of the unmodified luciferase vector (V) is unchanged by miR-24. (D) Predicted binding sites in the 3′UTR of genes whose 3′UTR was repressed by miR-24 in (C) and binding site mutations tested (indicated in red). (E) Expression of reporter genes containing wild-type (wt) AURKB MRE1, BRCA1 MRE5, CDC2 MRE1, CDK4 MRE1 and FEN1 MRE1 is significantly reduced upon co-transfection of HepG2 cells with miR-24 mimics (white) and not the control mimic (black). Mutations in the miR-24 pairing residues (mt) rescue luciferase expression (sequences and luciferase assays for all tested wt MREs for these genes in Suppl. Fig. 6,7). The CCNA2 MRE1 is not regulated. (F) However, miR-24 regulates a 181 nt region containing the CCNA2 MRE1 in the luciferase vector. Mutations in the binding residues of CCNA2 MRE1 within the extended sequence restore luciferase activity. Error bars in A, C and E represent mean ± SD from 3 independent experiments. **, p<0.01; *, p<0.05.
Fig. 7
Fig. 7
E2F2 is a key miR-24 target gene. (A) Increased cell proliferation from antagonizing miR-24 in K562 cells is blocked by siRNA-mediated knockdown of E2F2, but not MYC. Knockdown is shown by immunoblot (Suppl. Fig. 5). K562 cells were co-transfected with or without miR-24 ASO plus control siRNA or siRNAs targeting E2F2 and/or MYC. The rate of cellular proliferation was determined 72 hr later by thymidine incorporation. Error bars represent mean ± SD from 3 independent experiments. (B,C) Down-regulation of E2F2 mRNA (B) and protein (C) during TPA-mediated differentiation of K562 cells to megakaryocytes is mediated by miR-24 and can be completely inhibited by antagonizing miR-24. K562 cells were transfected with miR-24 or a control (CTL) ASO for 72 hr and then treated with TPA for 6 hr. mRNA was assessed by qRT-PCR normalized to GAPDH and normalized to control cells transfected with CTL ASO. E2F2 protein was quantified by densitometry and normalized to α-tubulin. (D,E) Transfection of K562 cells with a miR-24 mimic reduces cell proliferation, which can be rescued by expressing miR-24-insensitive E2F2, lacking the 3′UTR. K562 cells were co-transfected with a vector expressing HA-tagged E2F2 or GFP and miR-24 or cel-miR-67 (CTL) mimics for 72 hr before measuring thymidine uptake. (E) Immunoblot probed for HA tag. Error bars represent mean ± SD from 3 independent experiments. *, p<0.05, **, p<0.01; #, p<0.005 (F) Model of the miR-24, miR-17∼92, MYC, and E2F network of cell cycle regulators. Here we show that miR-24 directly suppresses expression of MYC and E2F2 (and indirectly suppresses E2F1 and E2F3) and thereby regulates the G1/S transition. Expression of the opposing miRNAs encoded by the miR-17∼92 and miR-106b∼25 clusters that promote cell proliferation is transcriptionally activated by the same transcription factors that miR-24 suppresses (O'Donnell et al., 2005; Petrocca et al., 2008). Therefore miR-24 would be predicted to reduce expression of the proliferation-promoting miRNA clusters indirectly. These miRNAs also knockdown the E2F genes, but probably to fine tune their proliferative effect. MYC may also suppress miR-24 transcription (Gao et al., 2009).

Similar articles

Cited by

References

    1. Baek D, Villen J, Shin C, Camargo FD, Gygi SP, Bartel DP. The impact of microRNAs on protein output. Nature. 2008;455:64–71. - PMC - PubMed
    1. Bar-Joseph Z, Siegfried Z, Brandeis M, Brors B, Lu Y, Eils R, Dynlacht BD, Simon I. Genome-wide transcriptional analysis of the human cell cycle identifies genes differentially regulated in normal and cancer cells. Proc Natl Acad Sci U S A. 2008;105:955–960. - PMC - PubMed
    1. Bartel DP. MicroRNAs: target recognition and regulatory functions. Cell. 2009;136:215–233. - PMC - PubMed
    1. Bracken AP, Ciro M, Cocito A, Helin K. E2F target genes: unraveling the biology. Trends Biochem Sci. 2004;29:409–417. - PubMed
    1. Calin GA, Ferracin M, Cimmino A, Di Leva G, Shimizu M, Wojcik SE, Iorio MV, Visone R, Sever NI, Fabbri M, et al. A MicroRNA signature associated with prognosis and progression in chronic lymphocytic leukemia. N Engl J Med. 2005;353:1793–1801. - PubMed

Publication types

MeSH terms