

Proteomics analysis reveals novel components in the detergent-insoluble subproteome in Alzheimer's disease
- PMID: 19746990
- PMCID: PMC2784247
- DOI: 10.1021/pr900474t
Proteomics analysis reveals novel components in the detergent-insoluble subproteome in Alzheimer's disease
Abstract
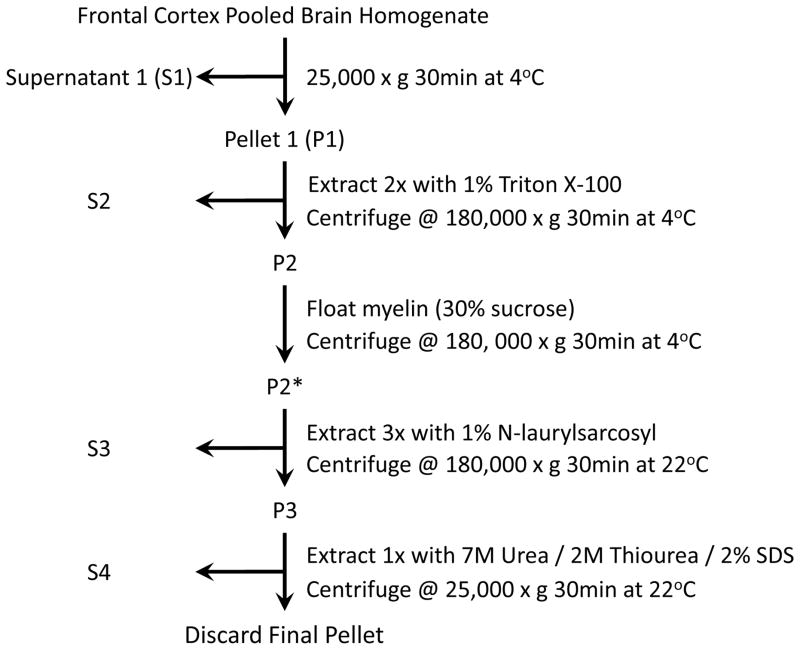
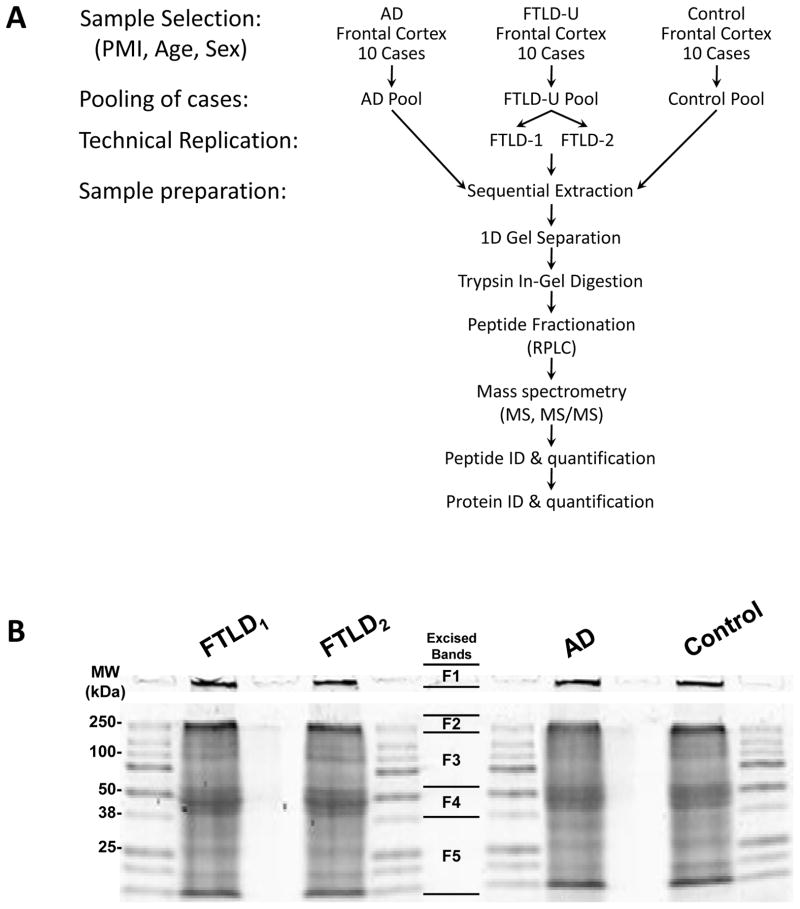
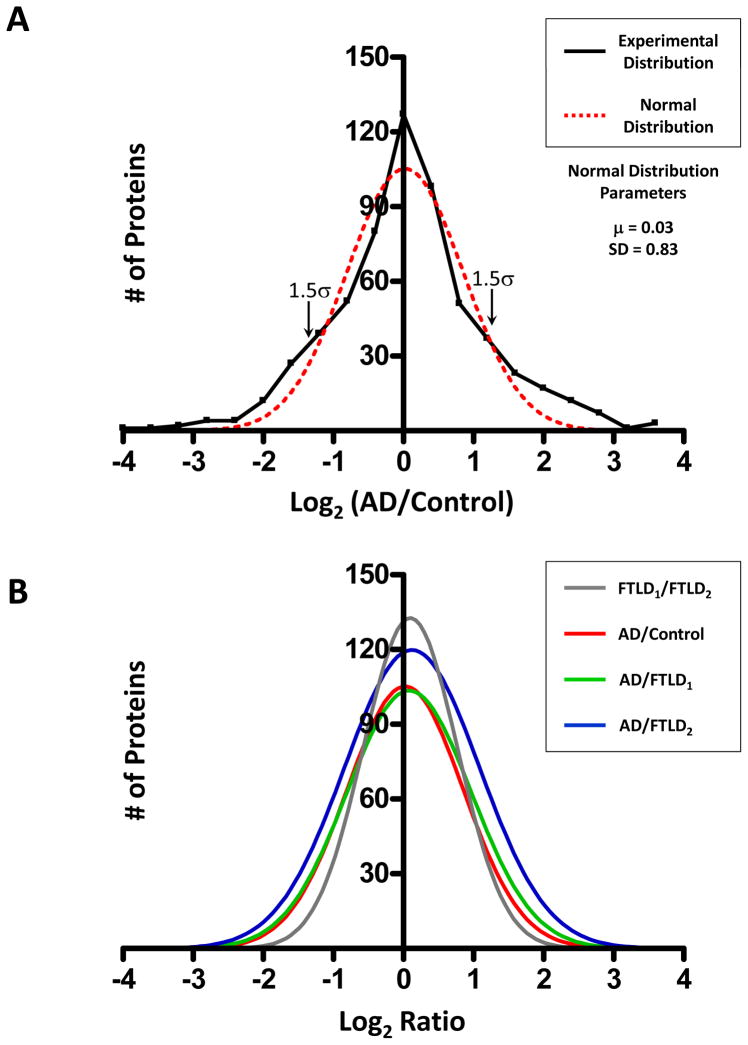
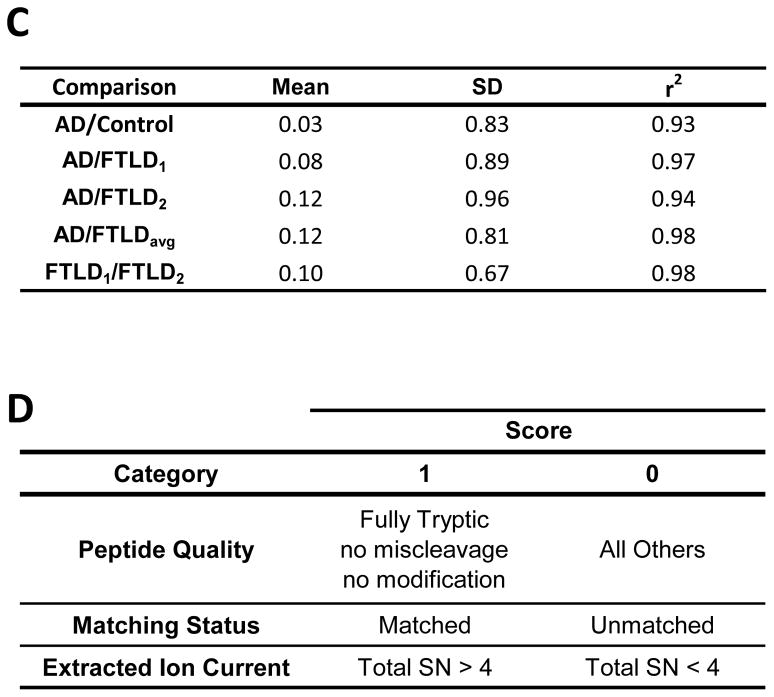
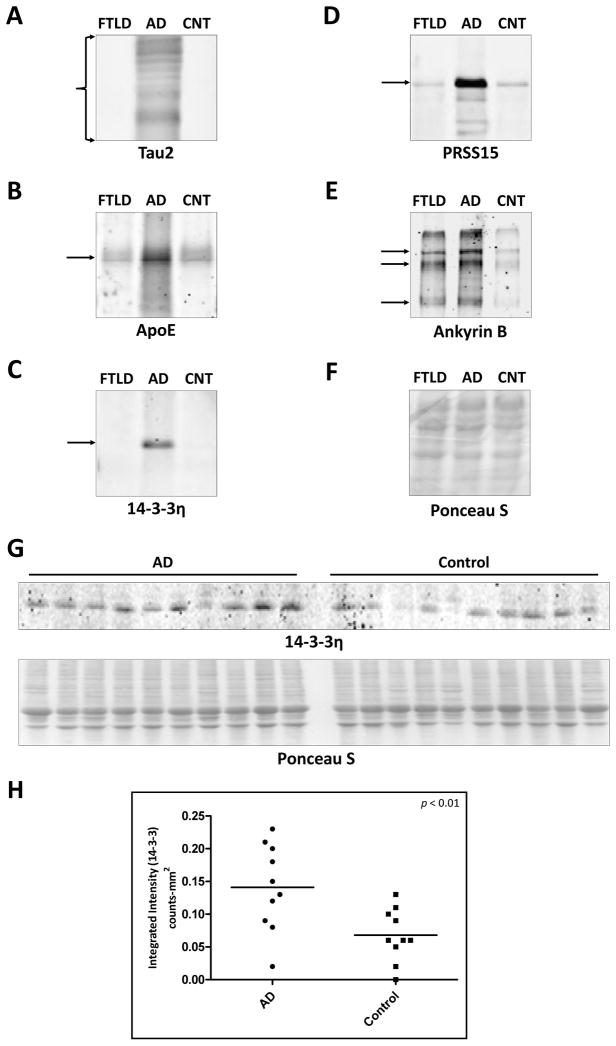
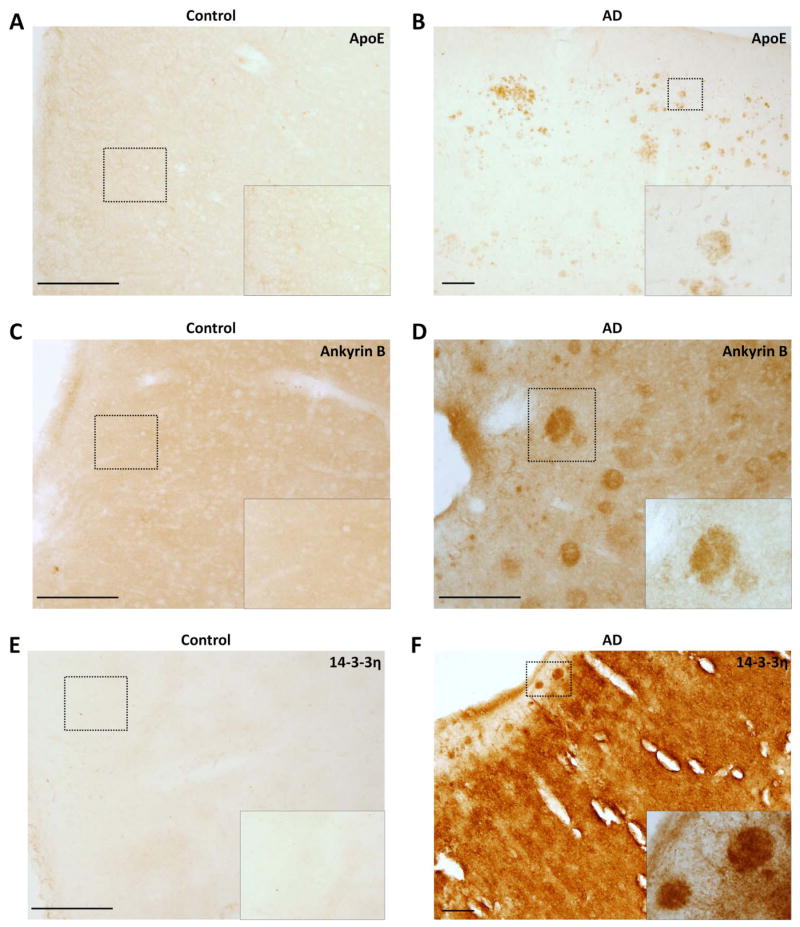
Neurodegenerative diseases are often defined pathologically by the presence of protein aggregates. These aggregates, including amyloid plaques in Alzheimer's disease (AD), result from the abnormal accumulation and processing of proteins, and may ultimately lead to neuronal dysfunction and cell death. To date, conventional biochemical studies have revealed abundant core components in protein aggregates. However, rapidly improving proteomics technologies offer opportunities to revisit pathologic aggregate composition, and to identify less abundant but potentially important functional molecules that participate in neurodegeneration. The purpose of this study was to establish a proteomic strategy for the profiling of neurodegenerative disease tissues for disease-specific changes in protein abundance. Using high resolution liquid chromatography coupled with tandem mass spectrometry (LC-MS/MS), we analyzed detergent-insoluble frontal cortex samples from AD and unaffected control cases. In addition, we analyzed samples from frontotemporal lobar degeneration (FTLD) cases to identify AD-specific changes not present in other neurodegenerative diseases. We used a labeling-free quantification technique to compare the abundance of identified peptides in the samples based on extracted ion current (XIC) of their corresponding ions. Of the 512 identified proteins, quantitation demonstrated significant changes in 81 AD-specific proteins. Following additional manual filtering, 11 proteins were accepted with high confidence as increased in AD compared to control and FTLD brains, including beta-amyloid, tau and apolipoprotein E, all well-established AD-linked proteins. In addition, we identified and validated the presence of serine protease 15, ankyrin B, and 14-3-3 eta in the detergent-insoluble fraction. Our results provide further evidence for the capacity of proteomics applications to identify conserved sets of disease-specific proteins in AD, to enhance our understanding of disease pathogenesis, and to deliver new candidates for the development of effective therapies for this, and other, devastating neurodegenerative disorders.
Figures
Similar articles
-
Changes in the detergent-insoluble brain proteome linked to amyloid and tau in Alzheimer's Disease progression.Proteomics. 2016 Dec;16(23):3042-3053. doi: 10.1002/pmic.201600057. Proteomics. 2016. PMID: 27718298 Free PMC article.
-
Dissecting Detergent-Insoluble Proteome in Alzheimer's Disease by TMTc-Corrected Quantitative Mass Spectrometry.Mol Cell Proteomics. 2023 Aug;22(8):100608. doi: 10.1016/j.mcpro.2023.100608. Epub 2023 Jun 24. Mol Cell Proteomics. 2023. PMID: 37356496 Free PMC article.
-
Quantitative analysis of the detergent-insoluble brain proteome in frontotemporal lobar degeneration using SILAC internal standards.J Proteome Res. 2012 May 4;11(5):2721-38. doi: 10.1021/pr2010814. Epub 2012 Apr 4. J Proteome Res. 2012. PMID: 22416763 Free PMC article.
-
Proteomic landscape of Alzheimer's Disease: novel insights into pathogenesis and biomarker discovery.Mol Neurodegener. 2021 Aug 12;16(1):55. doi: 10.1186/s13024-021-00474-z. Mol Neurodegener. 2021. PMID: 34384464 Free PMC article. Review.
-
Possible concurrence of TDP-43, tau and other proteins in amyotrophic lateral sclerosis/frontotemporal lobar degeneration.Neuropathology. 2018 Feb;38(1):72-81. doi: 10.1111/neup.12428. Epub 2017 Sep 27. Neuropathology. 2018. PMID: 28960544 Review.
Cited by
-
Proteomics of protein post-translational modifications implicated in neurodegeneration.Transl Neurodegener. 2014 Oct 30;3(1):23. doi: 10.1186/2047-9158-3-23. eCollection 2014. Transl Neurodegener. 2014. PMID: 25671099 Free PMC article. Review.
-
Changes in the detergent-insoluble brain proteome linked to amyloid and tau in Alzheimer's Disease progression.Proteomics. 2016 Dec;16(23):3042-3053. doi: 10.1002/pmic.201600057. Proteomics. 2016. PMID: 27718298 Free PMC article.
-
Apolipoprotein E Proteinopathy Is a Major Dementia-Associated Pathologic Biomarker in Individuals with or without the APOE Epsilon 4 Allele.Am J Pathol. 2022 Mar;192(3):564-578. doi: 10.1016/j.ajpath.2021.11.013. Epub 2021 Dec 24. Am J Pathol. 2022. PMID: 34954207 Free PMC article.
-
Systematic optimization of long gradient chromatography mass spectrometry for deep analysis of brain proteome.J Proteome Res. 2015 Feb 6;14(2):829-38. doi: 10.1021/pr500882h. Epub 2014 Dec 12. J Proteome Res. 2015. PMID: 25455107 Free PMC article.
-
Proteomic analysis of neurons microdissected from formalin-fixed, paraffin-embedded Alzheimer's disease brain tissue.Sci Rep. 2015 Oct 21;5:15456. doi: 10.1038/srep15456. Sci Rep. 2015. PMID: 26487484 Free PMC article.
References
-
- Blennow K, de Leon MJ, Zetterberg H. Alzheimer’s disease. Lancet. 2006;368(9533):387–403. - PubMed
-
- Goedert M, Spillantini MG. A century of Alzheimer’s disease. Science. 2006;314(5800):777–81. - PubMed
-
- Nunomura A, Perry G, Aliev G, Hirai K, Takeda A, Balraj EK, Jones PK, Ghanbari H, Wataya T, Shimohama S, Chiba S, Atwood CS, Petersen RB, Smith MA. Oxidative damage is the earliest event in Alzheimer disease. J Neuropathol Exp Neurol. 2001;60(8):759–67. - PubMed
-
- Tuppo EE, Arias HR. The role of inflammation in Alzheimer’s disease. Int J Biochem Cell Biol. 2005;37(2):289–305. - PubMed
Publication types
MeSH terms
Substances
Grants and funding
LinkOut - more resources
Full Text Sources
Other Literature Sources
Medical
